

As Yogi Berra said, “It’s tough to make predictions, especially about the future.” In spite of this, the US Census Bureau has given it their best shot. Census recently released its projections for how the population of the United States will change over the next 40 years and how its composition will change. It is the first update to their projections since 2014 and it shows that the biggest changes will be in the number of older Americans.
Making predictions
The Census Bureau adjusted their population growth projections to account for differences that they have observed between the native born and the foreign born populations. Studies have shown that the foreign born population tends to have more children than the native born population and the foreign born tend to live longer. The 2017 estimate is the first that attempts to account for these differences.
The study considers the fertility rates of three native born groups and three foreign born groups and includes estimates of how they will change over time. It includes estimates of migration rates to and from 6 different regions of the world and also projects how these rates will change over time. It also estimates how life expectancy will change over time by ethnic group. In short, this is a very sophisticated analysis.
So what does it show?
While the report makes projections out to 2060, we’ll limit ourselves to looking at the projections to 2040 here. The first chart shows the population distribution of the country by 5 year age cohorts. The bump in the 2016 curve around the 55 to 59 year old age cohort is from the “baby-boom” generation. The bump in the 2016 curve at the 25 to 29 cohort is from the Millennial generation.
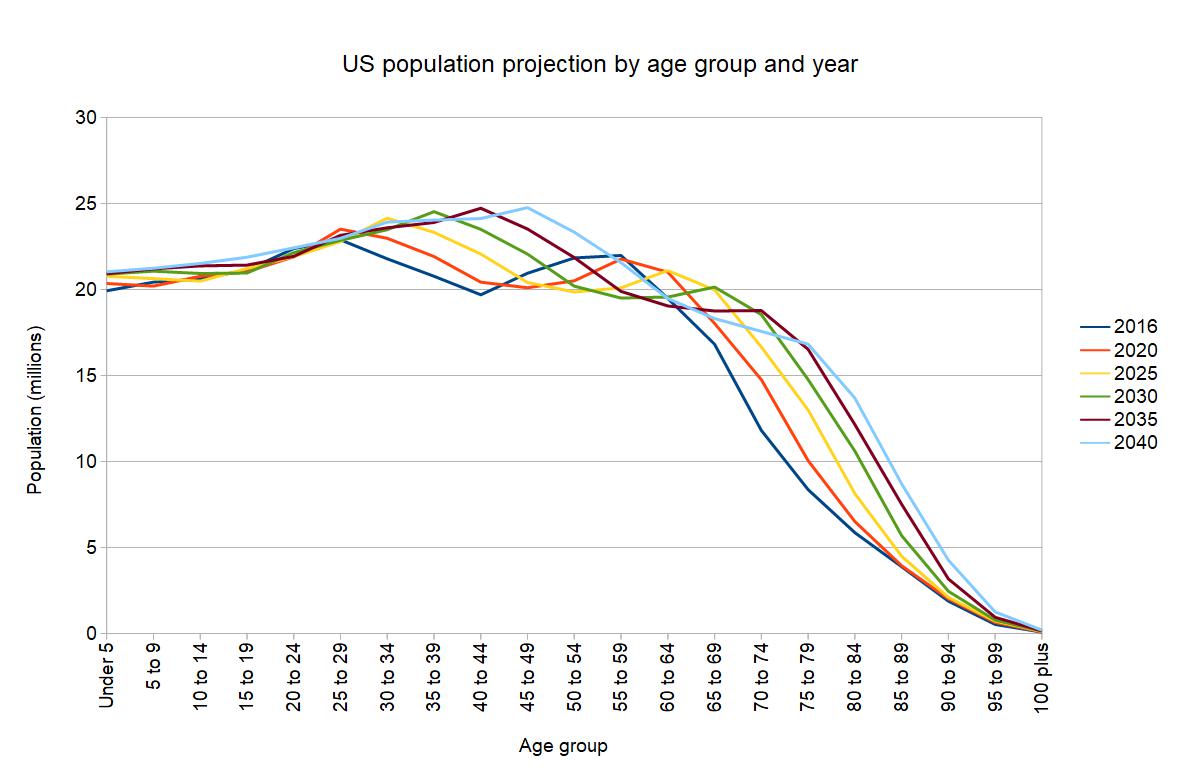
While the number of children in the population is not expected to change much over the time period studied, the number of older Americans is expected to change greatly. This is partly due to the baby-boom generation working its way through the population curve and partly due to an increase in life expectancy.
Big changes coming
Another way to look at the data is to compare the projected number of people in each age cohort with the equivalent number in the population today. That is what is done in the next chart. To generate this chart, the number of people in an age grouping in 2016 was subtracted from the number of people in that same age grouping for each future Census Bureau projection. The result is the increase or decrease in population of that age grouping compared to today. The chart focuses on people age 55 and above.
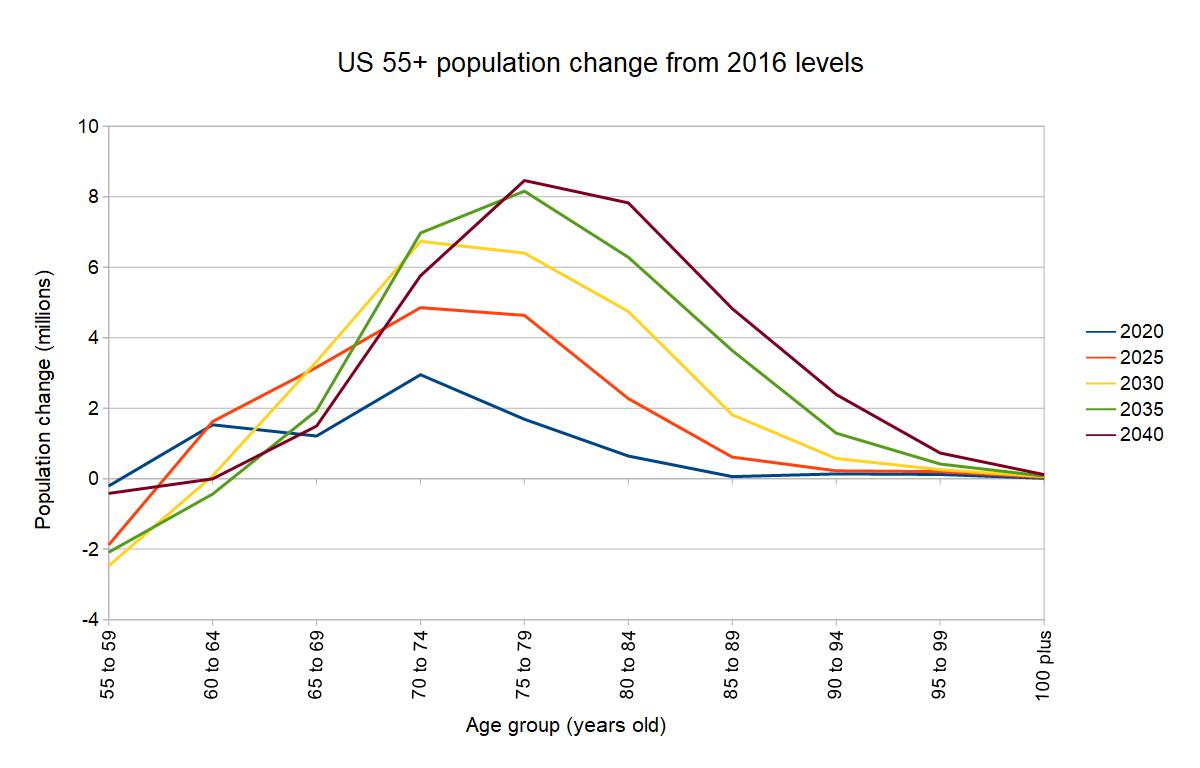
The chart shows that, by 2020, there will be 1.2 million more people aged 65 to 69, 2.9 million more aged 70 to 74, 1.7 million more aged 75 to 79 and 640 thousand more aged 80 to 84 than today. As time goes on, the increase in the older population is even more dramatic.
While the chart suggest that there will be tremendous opportunities in senior housing ahead, the case may not be as clear as it seems. To the extent that the population of older Americans is increasing due to increases in longevity, the onset of old age may be delayed. People now entering their 60s have had better nutrition, better healthcare, have engaged in more regular exercise and have had less physically demanding jobs than prior generations. They are just younger for their ages. The age at which they elect to move into senior housing may also be delayed.
Source: US Census Bureau, 2017 National Population Projections


