On Friday, the Bureau of Labor Statistics (BLS) released its report on job openings and labor turnover for February. As reported elsewhere, the headline report showed little change from the prior month for the jobs market as a whole. However, a closer look at the construction jobs market shows that it faces unique challenges.
Construction is unusual
A common refrain in the construction industry is that there are not enough workers available to fill all of the open positions. The first chart illustrates how the construction industry compares to the total private sector jobs market in terms of job openings, hires and terminations. Each of these measures is listed as a percentage of the total employment in the sector, so that direct comparisons can be made.
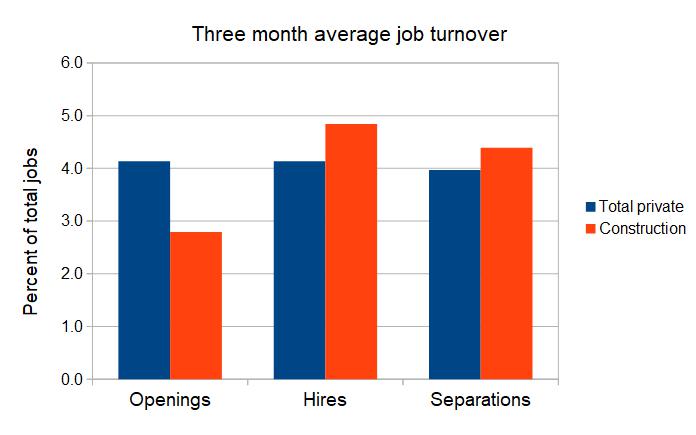
The job openings measure is taken at a point in time, in this case the end of the month. The hires and separations count any worker who was either hired or dismissed at any point in the month. The fact that the number of hires is so much greater than the number of job openings indicates that jobs in construction are being filled relatively quickly, at least in comparison to the amount of time required to fill jobs in the private sector as a whole.
Essentially, the job that was open at the end of the prior month was filled, a new job opened up and that may also have been filled so that the job that is open at the end of the current month is one or two generations away from the one open at the end of the prior month. The ratio of openings to hires gives an indication of how much time it takes to fill a job, on average.
Are things different now?
The next chart shows how openings, hires and separations have changed over the last year. The numbers reported for each month are actually the average of that month and the prior two months. This was done to smooth out some of the roughness in the data.
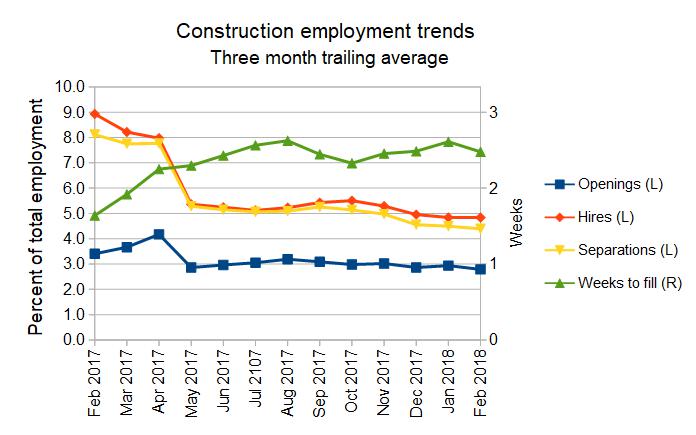
While the number of hires seemed high compared to the number of job openings in February, 2018, the ratio was much higher in February, 2017.
In this chart, the ratio of openings to hires was used to estimate the average amount of time required to fill a job. The result is shown in the green line which is associated with the right hand vertical axis. It shows that it took about 1.6 weeks on average to fill a construction job in February, 2017. It took closer to 2.5 weeks to fill a construction job in the January-February, 2018 time frame. The reports that construction jobs are becoming harder to fill seems to be borne out by the data.
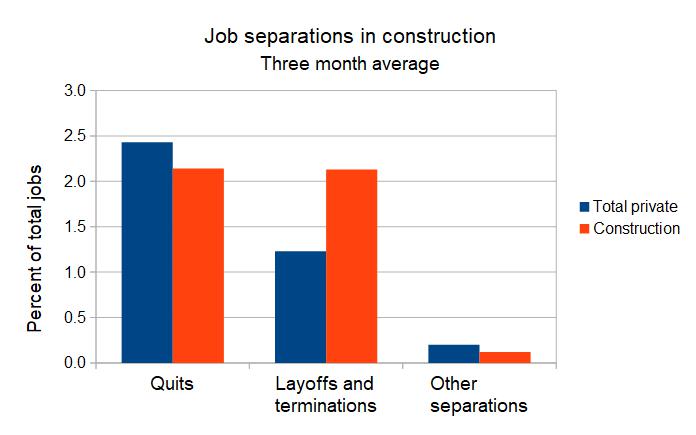
What else is different about construction?
The last chart looks at why people leave construction jobs. The data indicate that construction workers are somewhat less likely to quit their jobs than other workers but they are much more likely to be involuntarily terminated. For construction workers, involuntary terminations occur at almost the same rate as quits. For the private sector as a whole, this level of job insecurity was only seen at the depths of the recession in 2010. That this level of job insecurity exists in the middle of a hot market for construction jobs may help account for the reluctance of people to go into construction work.