

The Bureau of Labor Statistics (BLS) released its producer price index report for October. It showed that overall prices for processed goods for intermediate demand were up by 0.8 percent from September after two months of no change. Prices in October were 5.9 percent higher than a year earlier, in line with the rise seen last month. This compares with a 2.3 percent rise in the all-items consumer price index (CPI) in the 12 months to September.
The BLS price index of materials and components for construction fell 0.5 percent from September, 2018 but was 5.5 percent higher than a year earlier.
Multihousing Pro (PRO) compiled the BLS reported price changes for our standard list of construction materials. These are commodities whose prices directly impact the cost of constructing an apartment building. The two right hand columns of the table provide the percent change in the price of the commodity from a year earlier (12 Mo PC Change) and the percent change in price from September, 2018 (1 Mo PC Change).
While lumber prices had been leading the way up for the last 18 months or so, they have softened significantly over the last 3 months. Metal products, along with asphalt roofing and siding, have recently seen the fastest rate of price increases for construction materials.
| Commodity | 12 Mo PC Change | 1 Mo PC Change |
| Softwood lumber | -7.9 | -10.3 |
| Hardwood lumber | 3.4 | 1.2 |
| General millworks | 2.6 | 0.1 |
| Soft plywood products | 2.1 | 0.1 |
| Waferboard and oriented strand-board (OSB) | -11.0 | -0.2 |
| Hot rolled steel bars, plates and structural shapes | 18.8 | -1.3 |
| Copper wire and cable | 3.4 | 2.8 |
| Power wire and cable | 7.0 | 2.0 |
| Builder’s hardware | 3.3 | -0.3 |
| Plumbing fixtures and fittings | 2.5 | 0.4 |
| Enameled iron and metal sanitary ware | 1.6 | 0.0 |
| Furnaces and heaters | 6.3 | 0.5 |
| Sheet metal AC ducts and stove pipe | 0.7 | 0.5 |
| Electrical Lighting fixtures | 1.5 | -0.8 |
| Nails | 15.8 | 0.4 |
| Major appliances | 3.6 | -0.8 |
| Flat glass | 6.5 | -0.1 |
| Ready mix concrete | 3.2 | -0.6 |
| Asphalt roofing and siding | 10.3 | 1.1 |
| Gypsum products | 5.4 | -2.1 |
| Mineral wool insulation | 6.9 | 0.7 |
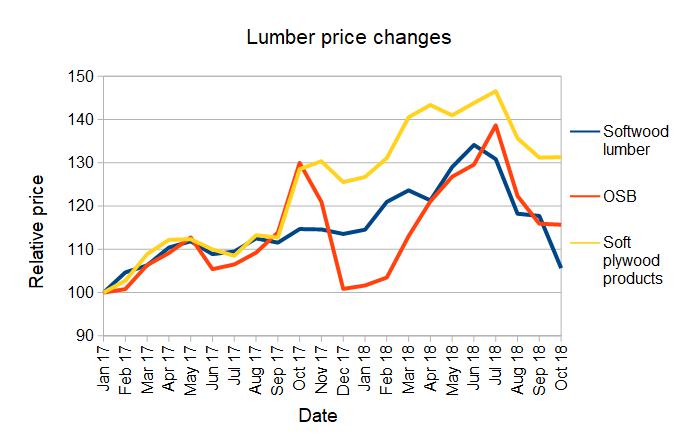
The chart below illustrates the price changes for softwood lumber, OSB and soft plywood over the past year and a half relative to their prices in January, 2017. It shows that these lumber prices are well off their recent peaks. The chart also makes clear that the large percentage decline in the price of OSB on a year-over-year basis listed in the above table is as much due to the spike in its price a year ago as it is to the recent drop in its price.
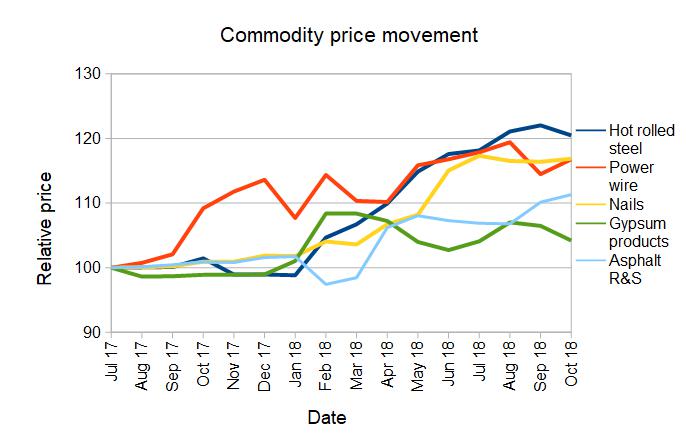
The final chart shows the price changes since July, 2017 of other construction materials which have experienced recent significant price increases. The chart shows the recent slow down in the rates of price increases for most of these commodities. However, power and copper wire and asphalt roofing and siding continue to move up in price.
The full BLS report can be found here.


