

The Costar Group recently released a report on the change in value of commercial property in the United States. This blog entry looks at the part of the report that deals with multifamily property values.
Everything is relative
The CoStar report focuses on a relative measure of property values called the CoStar Commercial Repeat Sales Index (CCRSI). This index is computed based on the resale of properties whose earlier sales price and sales date is known. The index represents the relative change in the cost of property over time rather than its absolute worth.
By focusing on repeat sales rather than all sales, the index compensates for the effects of potentially comparing the sales of properties with different characteristics in different time periods. However, by only using repeat sales, the number of transactions that can be used to calculate the index in any time period is reduced. In December, 2018, there were 1,321 sales pairs of all of the property types tracked by CoStar.
How does multifamily stack up?
The first chart shows how multifamily property values have changed over time relative to the values of the other commercial property types CoStar tracks. The data is normalized so that the index values for all property types are set to be 100 in December, 2000. The change in the value of the index since then shows how the value of that property type has changed.
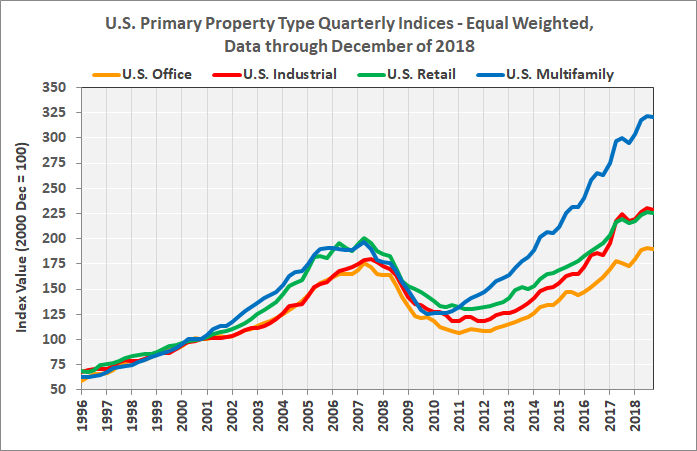
The chart shows that multifamily property values have risen faster than those of office, industrial or retail property, particularly since the recovery from the recent downturn began around 2010. While the chart shows a recent softening in multifamily property values, this appears to be part of an annual pattern and may not represent a weakening in the market for multifamily property.
Location, location, location
CoStar provided a link to the background data for the report which was used to generate the following two charts. These charts focus on the differences in the changes in multifamily property values in four regions of the country.
The first chart, below, shows how the indices for the four Census regions of the United States have changed since 2000. As before, each of the indices is normalized to a value of 100 in December, 2000, and the chart shows the relative change in value since then. Having a higher index value does not necessarily mean that the value of the property in dollars per door or dollars per square foot is higher.
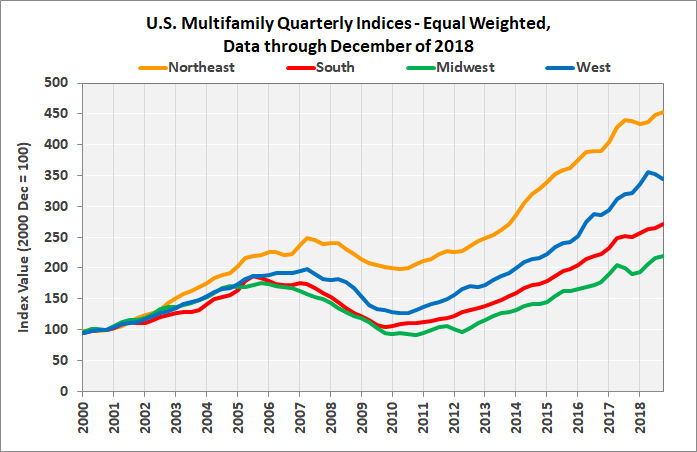
The chart shows that the Northeast has been the region with the strongest appreciation in multifamily property values since December, 2000, with prices rising by 352 percent since then. The Midwest has had the lowest property value appreciation with prices rising by only 120 percent. For comparison, the all-items consumer price index is up by 44 percent over that time period.
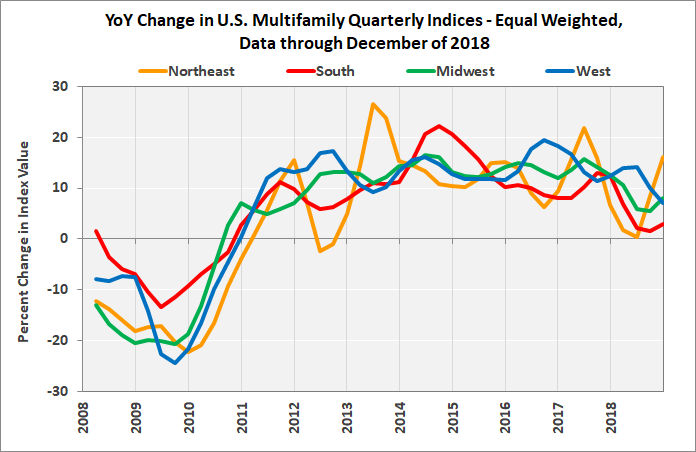
The next chart shows the year-over-year change in multifamily property values by region since 2008. The index values are calculated quarterly and show a high degree of volatility. While the Northeast currently leads all regions with a price jump of 16 percent, two quarters ago, it was the laggard with a year over year price increase of only 0.3 percent.
Has land peaked?
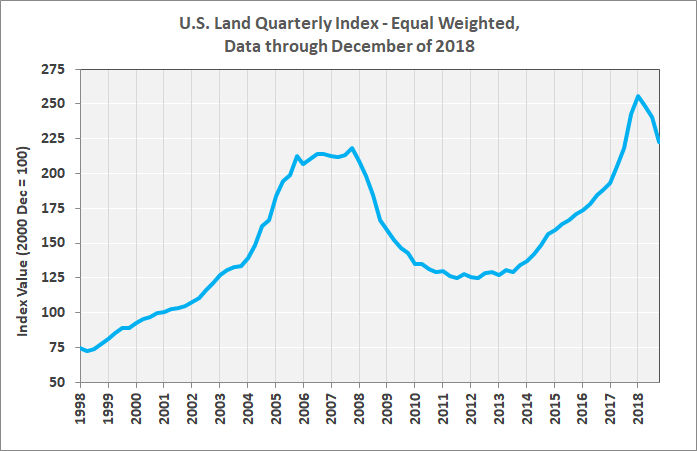
The final chart shows the CCRSI for land. While land values have risen since 2013, the surge in land values in 2017 seems to have been tempered by a decline in 2018. This, along with a recent decline in the costs of key construction materials, may enable more multifamily development projects to pencil out this year.
The full report from The CoStar Group can be found here.


