

The Census Bureau released its monthly new residential construction report for January 2019. If it seems like you were just reading about the December report last week, that’s because you were. Since the December report was greatly delayed by the government shutdown, the time between the reports was greatly compressed. In any event, the new report shows a multifamily housing construction market with conflicting signals with some metrics pointing to growth and some pointing to a slow down.
Permits continue surging
Nationally, permits for buildings with 5 or more units were up 5 percent from December at 482,000 units on a seasonally adjusted, annualized basis. Another 51,000 permits were issued for buildings with 2 to 4 units, a recent high. The rate of permit issuance for buildings with 5 or more units is the highest since March 2018 when 386,000 permits were issued. Compared to January 2018, permits were up by 6.9 percent.
Regional multifamily housing construction data is only reported for structures with two or more units. Structures with 5 or more units is not broken out as a separate category. Since this data is highly volatile and is frequently revised, it is examined here based on three month moving averages.
For the country as-a-whole, permit issuance for multifamily housing In January was up 8.3 percent from December and was up 7.6 percent from the year-earlier level. This is shown in the first chart, below. The surge in multifamily permits that we have seen developing over the last two months continued in January. However, as mentioned above, part of this surge is due to the exceptionally high level of permit issuance for buildings with 2 to 4 units. The 51,000 permits issued is well above the average of 38,000 seen over the past 18 months. The three month moving average for multifamily permits hit 501,000 in January.
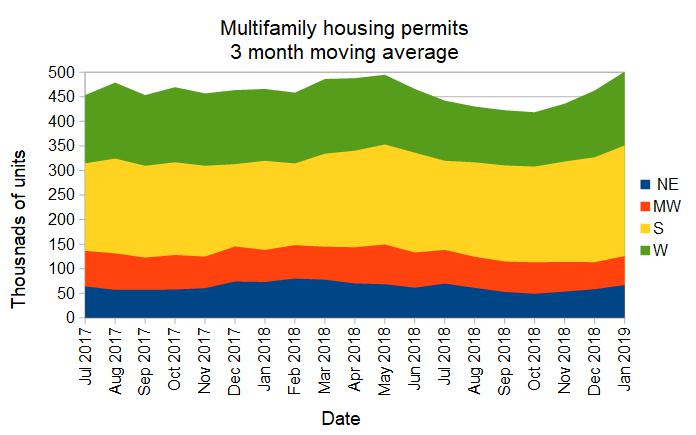
On a month over month basis, all four regions of the country saw growth in the number of multifamily permits issued. The Northeast saw the highest rate of growth with an increase of 14.3 percent. The West saw the largest increase in the number of permits issued with a rise of 14,000 units.
On a year-over-year basis, both the South and the West saw in increases in permits issued with rises of 24.3 percent and 2.7 percent respectively. Both the Northeast and the Midwest saw declines of around 9 percent.
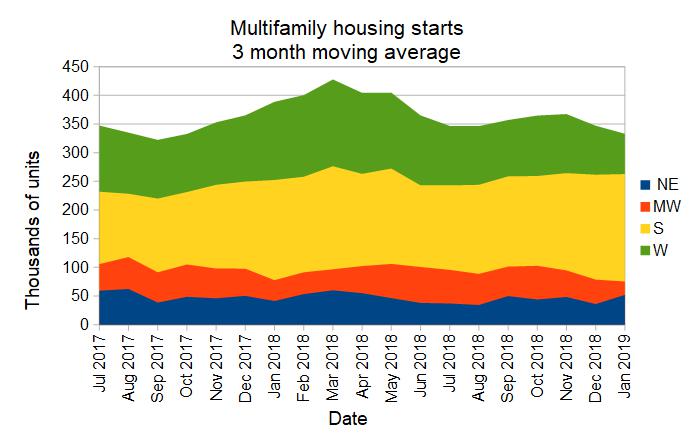
Multifamily housing construction starts trend downward
Construction starts for buildings with 5 or more units were up 4 percent from December to a level of 289,000 on a seasonally adjusted, annualized basis. Note however, starts were up only because the reported starts for December were adjusted down from the 302,000 units originally reported to an anemic 278,000. Construction starts in January for buildings with 5 or more units were also reported to be down from their levels of a year earlier, falling 33.6 percent from the extremely strong level of 435,000 starts seen in January 2018.
Multifamily housing construction starts (2+ units per building) were down only 5.5 percent from their December levels for the country as a whole, based on three month moving averages. The South was again the only region to see an increase, with a gain of 7.9 percent. The Northeast was again the weakest region with a decline in starts of 25.5 percent.
On a year-over-year basis, starts in the South were up by 20.4 percent compared to January 2018. For the country as a whole, starts were down 4.9 percent to an annualized level of 333,000 for the three month moving average.
The following chart shows the starts by region for the last 18 months.
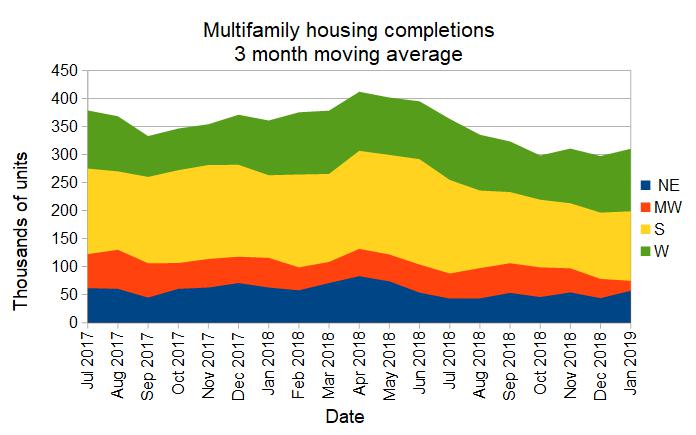
Completions rebound
Nationally, completions of buildings with 5 or more units were reported to be a relatively strong 327,000 units. This was up 24.8 percent from the December level, which was itself adjusted down from 296,000 units on an annualized basis in the preliminary report to a very weak 262,000 units. On a year-over-year basis, completions in January were down by 6 percent.
Nationally, completions for multifamily housing (2+ units per building) were up 4.4 percent compared to the month-earlier level. Completions were up in all regions except for the Midwest. The Northeast saw an increase of 30.5 percent in completions while the West and the South saw gains of 10.6 percent and 4.8 percent respectively.
On a year-over-year basis, completions were down strongly in all regions except the West, where completions rose 14.3 percent. Nationally, multifamily housing completions were down by 14 percent based on three month moving averages, at 310,000 annualized completions.
Completions by region for the past 18 months are shown in the chart below.
All multifamily housing construction data quoted are based on seasonally adjusted results and are subject to revision.


