

The Census Bureau released its monthly new residential construction report for February 2019. The report shows a market with conflicting signals with permit issuance and building starts going in opposite directions.
Permits soften
Nationally, permits for buildings with 5 or more units were down by 2.9 percent from January to 439,000 units on a seasonally adjusted, annualized basis. However, permits for January were revised downward by 30,000 units in this report. The revised figure for January indicates that permits actually declined from the December level, rather than experiencing 5 percent growth as was reported last month. Therefore, the reported decline for February is more significant than the 2.9 percent figure would indicate.
Another 36,000 permits were issued for buildings with 2 to 4 units. This is down 18 percent from the 44,000 permits in the revised report for January and down 30 percent from the 51,000 permits in the preliminary report for January issued last month.
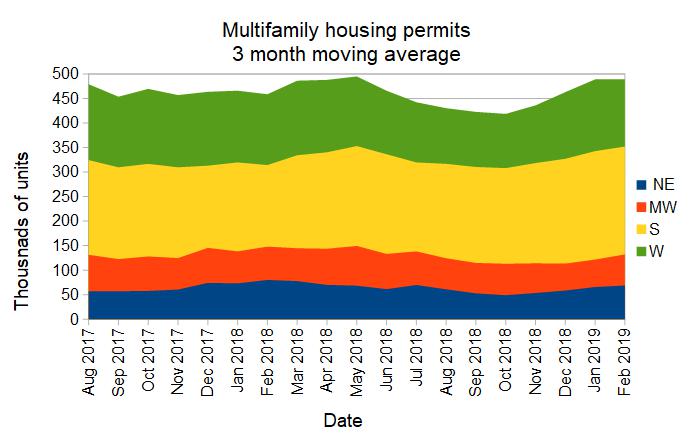
Regional data for multifamily housing is only reported for structures with two or more units. Structures with 5 or more units is not broken out as a separate category. Since this data is highly volatile and is frequently revised, it is examined here based on three month moving averages.
For the country as-a-whole, the three-month moving average for permit issuance for multifamily housing In February was effectively unchanged from January but was up 6.7 percent from the year-earlier level. This is shown in the first chart, below. With the decline in permits in February and the downward revision to the January numbers, it is possible the wave of new permits we have seen since last October has crested.
On a month over month basis, the directions of the four regions of the country diverged. The Northeast and the Midwest saw an increase in permitting activity. Activity in the South was nearly unchanged while activity in the West declined.
On a year-over-year basis, all regions except the South saw declines in the numbers of permits issued. The South saw 32 percent growth in permits issued on a three-month moving average basis. Of the permits issued nationally, 45 percent were issued in the South. The worst performing region was the Northeast, but the annual decline was partly due to the fact that the year-earlier month was exceptionally strong.
Multifamily housing construction starts continue downward trend
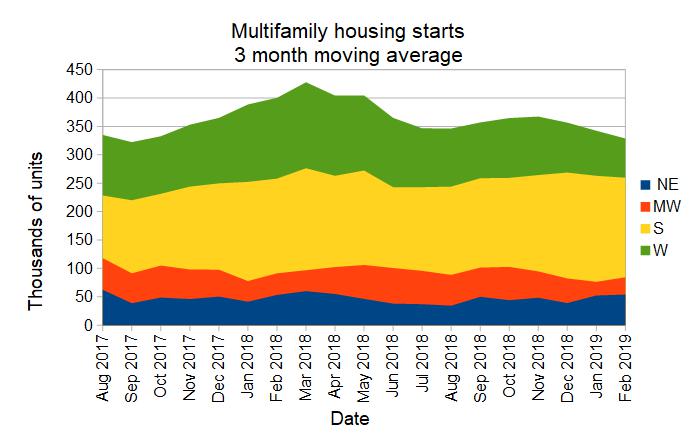
Construction starts for buildings with 5 or more units were up 23.5 percent from January to a level of 352,000 on a seasonally adjusted, annualized basis. The figures for January and December were both revised, with January starts being revised down by 4,000 units but December starts being revised up by 27,000 units. Compared to year-earlier levels, construction starts for buildings with 5 or more units were down by 5.4 percent. However, as the chart below illustrates, early 2018 was a period in which an unusual number of construction starts were made.
Multifamily housing construction starts (two or more units per building) were down 4 percent from their January levels for the country as a whole, based on three-month moving averages. The Midwest saw a big increase in starts, but from an exceptionally low level. The Northeast eked out a small increase in starts while the South and the West saw the number of starts decline. The decline in the West was 13 percent.
On a year-over-year basis, starts were down 18 percent for the country as a whole. The three-month moving average of starts was at an annualized level of 329,000 units. By region, starts were up slightly in the South and in the Northeast. Starts declined by 20 percent in the Midwest and by 51 percent in the West.
The following chart shows the starts by region for the last 18 months.
Completions blow the roof off
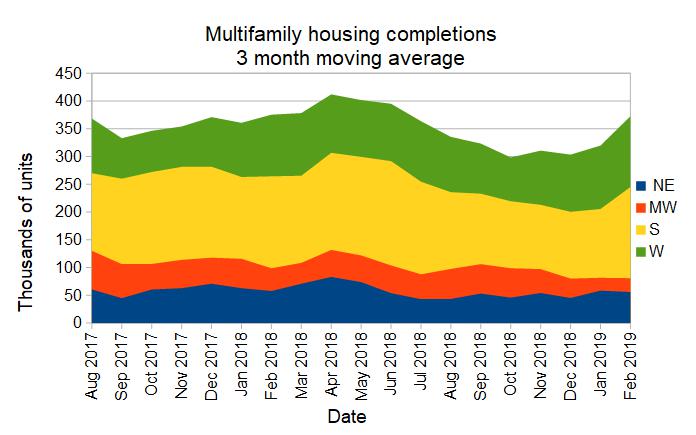
Nationally, completions of buildings with 5 or more units were reported to be a remarkably strong 473,000 units on an annualized basis. This was up 40 percent from the January level, which was itself adjusted up by 10,000 units. On a year-over-year basis, completions in February were up by 18 percent.
Nationally, completions for multifamily housing (two or more units) were up 17 percent month-over-month when comparing three-month moving averages. Completions were up in all regions except for the Northeast, where they fell by 5 percent. The South experienced an increase of 33 percent in completions while the West and the Midwest saw completions increase by 12 percent and 9 percent respectively.
On a year-over-year basis, completions were up in the West, nearly unchanged in the South, down slightly in the Northeast and down strongly in the Midwest. Nationally, multifamily housing completions were nearly unchanged based on three month moving averages, at 373,000 annualized completions.
Completions by region for the past 18 months are shown in the chart below.
All data quoted are based on seasonally adjusted results and are subject to revision.


