

This week, the Census Bureau released its population growth estimates for 2018 broken down by local geographical units. Data is available for each county in the country as well as for the 390 metropolitan areas and 555 micropolitan areas in the United States and Puerto Rico defined by the Census Bureau. This post will focus on population changes in the larger metropolitan areas.
Where the population growth is
The first interesting result from the Census Bureau estimates is that, while the population of the country increased by 18,409,329 from 2010 to 2018, the population of the metropolitan statistical areas (MSAs) increased by 18,613,226, representing 100.1 percent of the total population growth. That is, while the population of the country grew 6 percent during those 8 years, the rest of the country lost population to the larger metropolitan areas.
And “larger metropolitan areas” is a relative term. The smallest metropolitan statistical area had a population of just under 56,000 people in 2010.
Forty of the MSAs defined by the Census Bureau saw population increases of more than 100,000 people from 2010 to 2018. The MSA that saw the largest population growth was the Dallas-Ft. Worth-Arlington metro area, which added 1,113,489 people. The top ten metros for population growth between 2010 and 2018 are shown in the following table
| Metro Area | Population Growth |
| Dallas | 1,113,489 |
| Houston | 1,076,897 |
| Phoenix | 664,835 |
| Atlanta | 663,201 |
| Miami | 632,488 |
| Washington DC | 613,587 |
| Seattle | 499,558 |
| Los Angeles | 462,540 |
| Austin | 451,995 |
| Orlando | 438,560 |
Of these MSAs, the ones with the highest percentage population growth from 2010 to 2018 are Austin at 26.3 percent, and Orlando at 20.5 percent. All of the MSAs listed in the table saw double digit population growth on a percentage basis except for Los Angeles, where growth was only 3.6 percent, well below the national average.
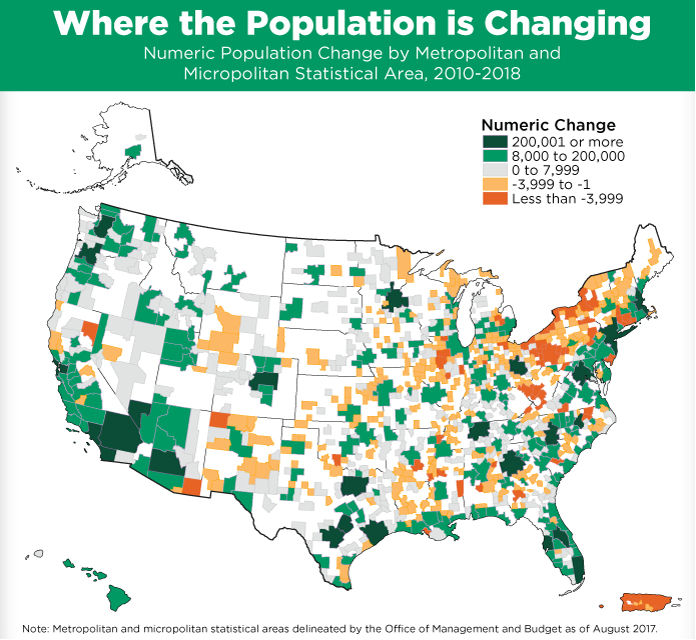
And where it is not
Of the 51 MSAs with populations over 1,000,000 people in 2010, 5 lost population between 2010 and 2018, just under 10 percent of this group. They are Rochester, NY; Buffalo, NY; Hartford Conn.; Cleveland, Ohio and Pittsburgh, Pa. Interestingly, Detroit and Baltimore, which are the poster children for population loss, managed to gain population in their MSAs between 2010 and 2018. However, this may be due more to growth in the outlying areas of the MSAs rather than to population increases in the cities themselves.
Of 137 MSAs with populations between 100,000 and 200,000 people in 2010, 46 lost population by 2018. This represents 33.5 percent of the MSAs of this size.
It would appear from this report that the concentration of the American population into the larger metropolitan areas continues apace.
The Census Bureau’s news release can be found here.


