

The Bureau of Labor Statistics (BLS) released its producer price index report for August 2019. It showed that overall prices for processed goods for intermediate demand fell by 0.7 percent in the month largely driven by falls in the prices of energy goods. The index was also 2.8 percent lower than its year-ago level. Excluding food and energy, the price index for processed goods for intermediate demand was down by 0.4 percent.
The BLS index of construction materials prices was up 0.2 percent from July 2019, before seasonal adjustment. It was 1.2 percent higher than its year-earlier level.
For reference, the changes in these indices compare with a 1.8 percent rise in the all-items consumer price index (CPI-U) for the 12 months ending in July.
Multihousing Pro (PRO) compiled the BLS reported changes for our standard list of construction materials prices. These are the prices of commodities which directly impact the cost of constructing an apartment building. The two right hand columns of the table provide the percent change in the price of the commodity from a year earlier (12 Mo PC Change) and the percent change in price from June 2019 (1 Mo PC Change). If no price data is available for a given commodity, the change is listed as N/A.
| Commodity |
12 Mo PC Change |
1 Mo PC Change |
| Softwood lumber |
-11.7 |
-0.5 |
| Hardwood lumber |
-9.2 |
-1.5 |
| General millworks |
2.1 |
-0.2 |
| Soft plywood products |
-21.3 |
-3.5 |
| Hot rolled steel bars, plates and structural shapes |
-7.9 |
-1.9 |
| Copper wire and cable |
-6.8 |
-0.5 |
| Power wire and cable |
-3.5 |
-0.7 |
| Builder’s hardware |
3.0 |
0.0 |
| Plumbing fixtures and fittings |
7.0 |
0.4 |
| Enameled iron and metal sanitary ware |
0.6 |
-0.1 |
| Furnaces and heaters |
8.7 |
-1.4 |
| Sheet metal products |
1.1 |
0.1 |
| Electrical Lighting fixtures |
12.9 |
4.6 |
| Nails |
-2.3 |
-0.8 |
| Major appliances |
2.9 |
-0.8 |
| Flat glass |
4.7 |
3.0 |
| Ready mix concrete |
4.0 |
0.9 |
| Asphalt roofing and siding |
3.7 |
0.3 |
| Gypsum products |
-8.4 |
0.1 |
| Mineral wool insulation |
-7.6 |
-4.1 |
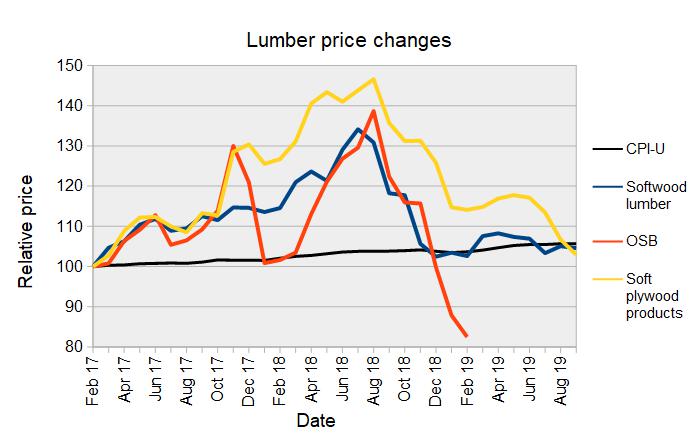
Lumber prices are down significantly from their recent highs and have been relatively stable this year. In fact, compared to their January 2017 levels, prices of these products have risen at or below the general rate of inflation as measured by the CPI-U. Price changes for softwood products are show in the first chart.
The BLS has dropped Oriented Strand Board (OSB) from its report so it will no longer be tracked.
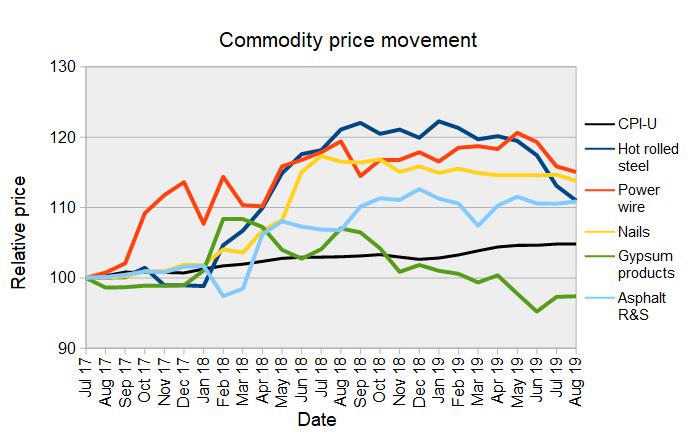
 The prices of several construction commodities which surged last year are illustrated in the next chart, below. The chart shows that they have largely stabilized since last fall and some of them have actually fallen in price recently. However, gypsum products are the only ones whose prices have returned to their levels before the recent surge.
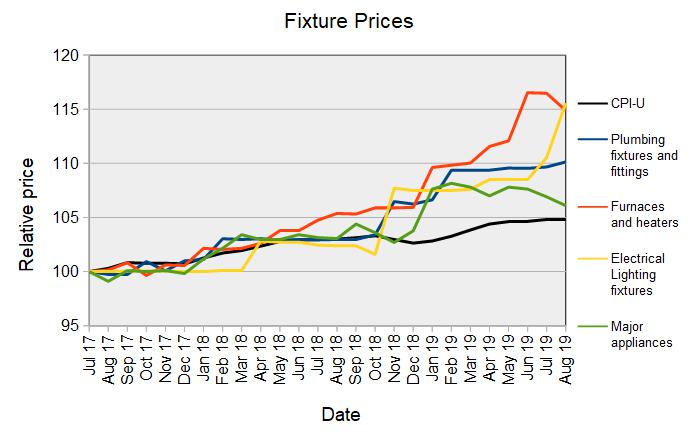
The construction materials prices which have risen the most in recent months are more finished goods. Prices electrical lighting fixtures have been surging recently, with a jump of 4.6 percent in the last month and 12.9 percent in the last year. The prices of furnaces and heaters are also up strongly in the last year with a rise of 8.7 percent. However, their prices have fallen 1.4 percent in the last month. In addition, plumbing fixtures and fittings have jumped in price over the last year, rising 7 percent. These price changes are illustrated in the final chart, below.
The full BLS report can be found here.


