

The Census Bureau released its monthly new residential construction report for December 2019. Permits for multifamily units were down slightly from their recent torrid pace while starts surged and completions also ticked upward from recent levels.
Permits take a breather
The number of permits issued for buildings with 5 or more units fell in December to 458,000 units on a seasonally adjusted, annualized basis. While this is down 11 percent from the revised figure for November, November’s reading of 515,000 units is the highest level recorded since 2015. The number of permits issued in December actually matched the average level for 2019 which was itself almost 9 percent above the monthly average for 2018.
In addition, 42,000 permits were issued in December for buildings with 2 to 4 units, also near the average level for 2019.
Regional data for multifamily housing is only reported for structures with two or more units. “Structures with 5 or more units” is not broken out as a separate category. Since the regional data is highly volatile and is frequently revised, it is examined here based on three-month moving averages.
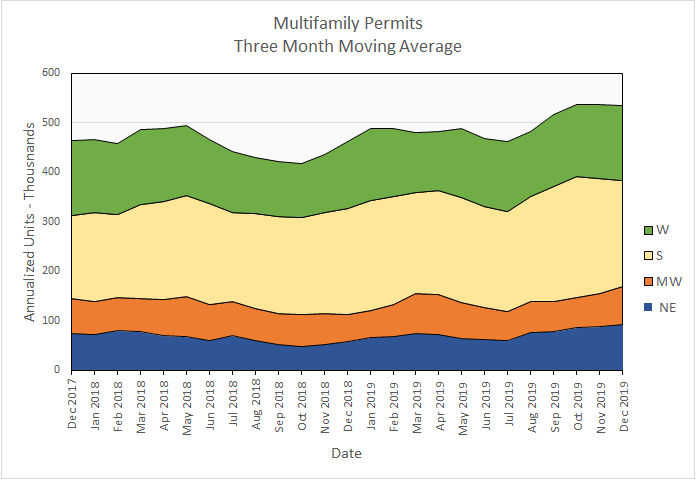
Nationally, the three-month moving average for permits issued for multifamily housing in December was down less than one percent from October but was up 15 percent from the level of December 2018. This is shown in the first chart, below.
On a month over month basis, the permit issuance was up in the Midwest and the Northeast, by 14.4 and 5.7 percent respectively. It was essentially unchanged in the West and was down nearly 8 percent in the South.
Compared to year-earlier levels, the number of units permitted rose strongly in all regions except the South where they were unchanged. The increase was 60 percent in the Northeast and nearly 40 percent in the Midwest.
Multifamily housing construction starts jump
Multifamily housing construction starts continued to be choppy with the numbers reported month by month often rising and falling by 25 percent or more. In December, the level of construction starts for buildings with 5 or more units was up by 32 percent from the revised figure for the month earlier. The 536,000 starts reported on a seasonally-adjusted, annualized basis, is the highest level reported since July 1986. Since the numbers first reported are often revised in subsequent reports, it will be interesting to see if this number is confirmed in future reports.
Compared to year-earlier levels, construction starts for buildings with 5 or more units were also up, rising nearly 75 percent from the December 2018 level.
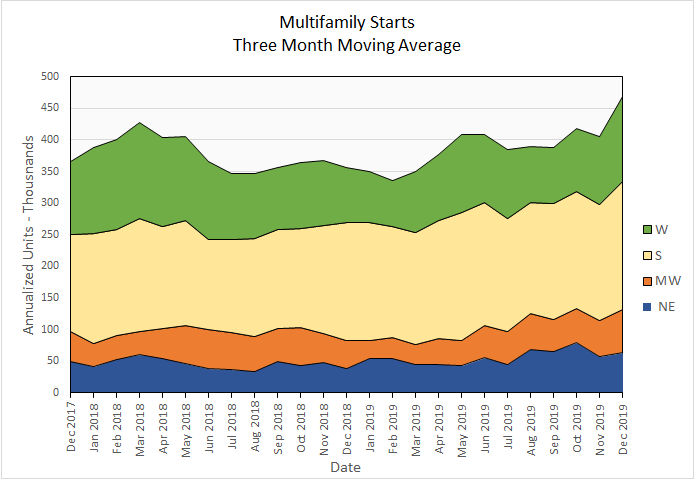
Multifamily housing construction starts (two or more units per building) were up 15.5 percent from their November levels for the country as-a-whole, based on three-month moving averages. The Midwest and the West each saw starts rise by around 20 percent on the month while the Northeast and the South each saw starts rise by around 10 percent.
On a year-over-year basis, starts were up 31 percent for the country-as-a-whole. Starts surged in the Northeast, Midwest and West by 62, 58 and 52 percent respectively compared to year-earlier levels. Starts were up a mere 9 percent in the South.
The following chart shows the starts by region for the last 25 months.
Completions bounce back
Nationally, completions of buildings with 5 or more units have also been following an up-and-down pattern recently. They were up in December to 357,000, a nearly 20 percent increase on a relatively weak report for November. Compared to the year-earlier level, completions of building with 5 or more units in December were up 26.1 percent, although December 2018 was also a relatively week month for completions because of bad weather in the fall of that year.
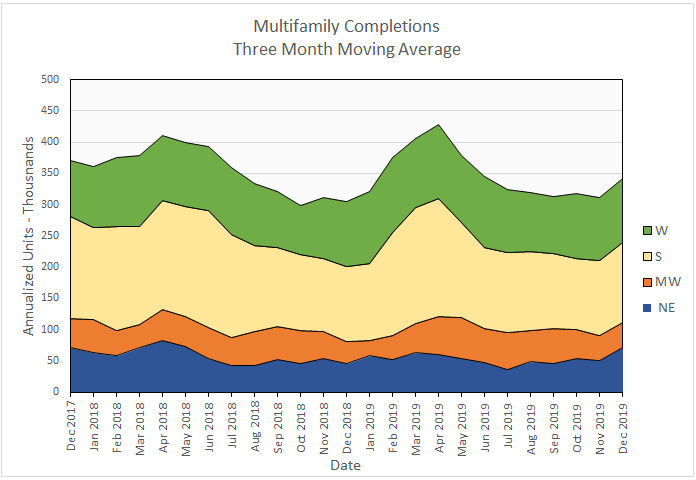
For the country as-a-whole, completions for multifamily housing (two or more units per building) were up 10 percent month-over-month, comparing three-month moving averages. While completions have been running below their two-year average recently, the three-month moving average is now at its highest level since June.
By region, the three-month moving averages of completions were up nearly 41 percent in the Northeast and 7 percent in the South. They were up slightly in the West and sown slightly in the Midwest.
On a year-over-year basis, the three-month moving average of completions was up by 12 percent. By region, the Northeast saw a 60 percent jump in completions while the Midwest saw an 11 percent rise. Completions were up slightly in the South and Unchanged in the West.
Completions by region for the past 25 months are shown in the chart below.
All data quoted are based on seasonally adjusted results and are subject to revision.


