

The Census Bureau released its monthly new residential construction report for February 2020. It presents a mixed picture for multifamily housing construction with areas of both strength and weakness.
Permits decline
The number of permits issued for buildings with 5 or more units fell sharply in February to 415,000 units on a seasonally adjusted, annualized basis. This was down 20 percent from the revised figure for January and also down 5 percent from the number of permits issued in February 2019.
While this figure is well below the 2019 monthly average of 458,000 permits, there is often wide variation in the figures, month-to-month. For example, the June 2019 permit figure came in at 363,000 while no other monthly figure was less than 436,000 during 2019. Still, next month’s report will bear watching to see if this fall-off in permitting activity is an anomaly or the start of a trend.
In addition, 45,000 permits were issued in February for buildings with 2 to 4 units. This was up slightly from the previous month.
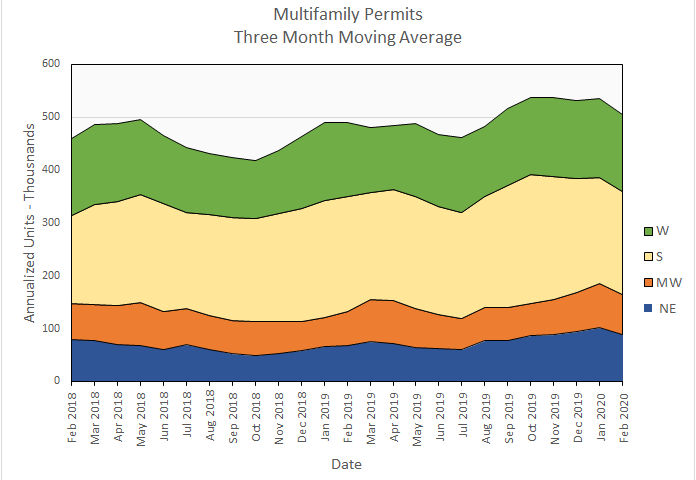
Regional data for multifamily housing is only reported for structures with two or more units. “Structures with 5 or more units” is not broken out as a separate category. Since the regional data is highly volatile and is frequently revised, it is examined here based on three-month moving averages.
Nationally, the three-month moving average for permits issued for multifamily housing in February was down 6 percent from the January level but was up a little over 3 percent from the level of February 2019. This is shown in the first chart, below. While the chart shows a slight slackening of the recent torrid pace of permit issuance, the rate still exceeds 500,000 units on an annualized basis.
On a month over month basis, permit issuance was down in all regions of the country. Permits fell 10 to 12 percent in the Northeast and the Midwest and fell by 2 to 3 percent in the South and the West.
Compared to year-earlier levels, permits declined only in the South, where they fell by 10 percent. Permits were up by 30 percent in the Northeast, 17 percent in the Midwest and 5 percent in the West compared to February 2019.
The following chart shows the permits by region for the last 25 months.
Multifamily housing construction starts down but still strong
A big surprise in this month’s report was that the multifamily housing construction (5 or more units per building) starts reported for January was revised upward from a very strong figure of 547,000 starts to 612,000 starts on a seasonally adjusted, annualized basis. The underlying, unadjusted number of unit starts has only been exceeded once in the last 30+ years. With this as the basis for comparison, it should be no surprise that the figure for February was down 17 percent from January. However, the February level of 508,000 unit starts was up 44 percent from the year-earlier level, showing that starts still remain strong.
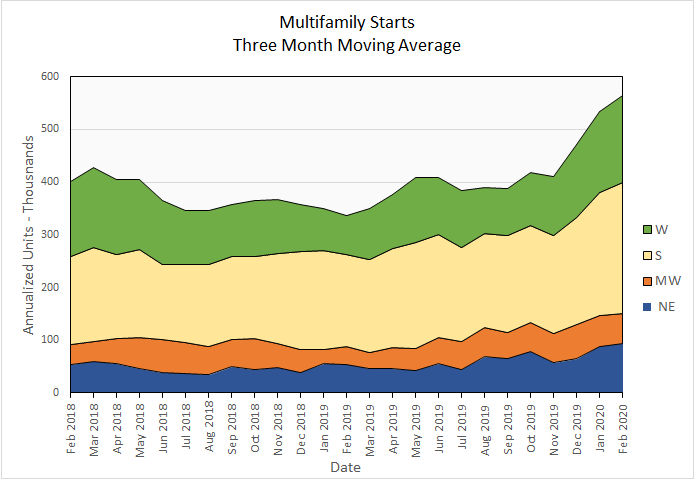
Multifamily housing construction starts (two or more units per building) in February were up 5 percent from their January levels for the country as-a-whole, based on three-month moving averages. All regions of the country saw unit starts rise by 6 to 7 percent except for the Midwest where they fell by just over 1 percent.
On a year-over-year basis, starts were up 68 percent for the country-as-a-whole. Starts were up 126 percent in the West and up around 72 percent in the Northeast and the Midwest. While unit starts were up “only” 41 percent in the South, it continues to be the most active area of the country. Unit starts in the South represent 44 percent of those for the country as-a-whole.
The following chart shows the starts by region for the last 25 months.
Completions fall
Another surprise in this report is that the number of completions in buildings with 5 or more units was reported to have fallen sharply to only 280,000 units on a seasonally adjusted, annualized basis. This is down 31 percent from the revised estimate of 408,000 units completed in January and was down 41 percent from the exceptionally strong level of February 2019.
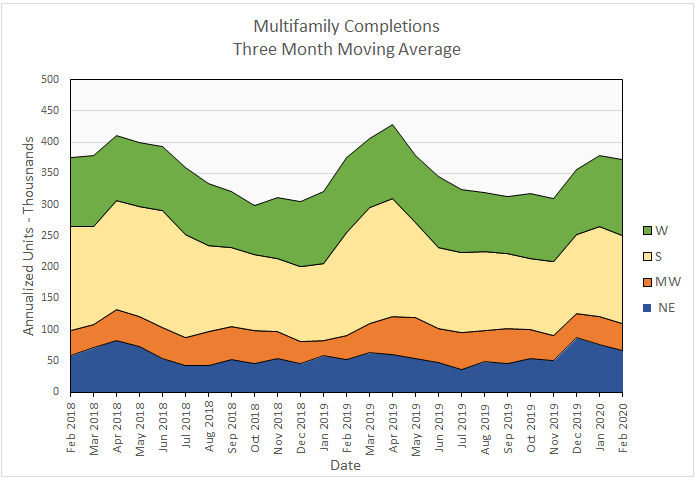
For the country as-a-whole, completions for multifamily housing (two or more units per building) were down only 2 percent month-over-month, comparing three-month moving averages. This relatively mild decline is due to the moving average taking some of the month-to-month volatility out of the reported figures and may represent a more realistic view of what is happening.
By region, the three-month moving averages of completions were down 12 percent in the Northeast, 7 percent in the Midwest and 1 percent in the South. Completions rose in the West by 7 percent.
On a year-over-year basis, the three-month moving average of completions was down 1 percent nationally driven by a 14 percent decline in the South. Unit completions rose in the Northeast by 27 percent and by 10 percent in the Midwest. Unit completions were virtually unchanged in the West.
Completions by region for the past 25 months are shown in the chart below.
All data quoted are based on seasonally adjusted results and are subject to revision.


