

The Mortgage Bankers Association (MBA) recently issued their report on Q4 2019 debt outstanding on commercial property. This article summarizes the part of the report dealing with multifamily property debt.
Measuring total multifamily mortgage debt
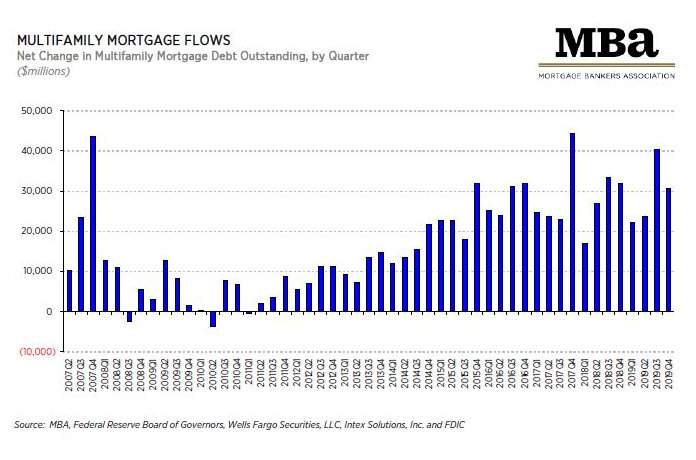
Total multifamily mortgage debt rose by $30.5 billion in the fourth quarter of 2020, down from an increase of $40.6 billion during the third quarter. For the year, outstanding multifamily mortgage debt increased by $116.7 billion, or 8.2 percent. At year-end 2019, total multifamily mortgage debt stood at $1.53 trillion, representing 42 percent of the total outstanding commercial mortgage debt.
Since the last recession, money has been flowing strongly into multifamily mortgages. While the level of inflow has seemingly plateaued since 2016, the increases seen in the last two quarters in outstanding multifamily mortgage debt have been running above the recent average. This is shown in the following chart which was reproduced from the report.
Where’s the money coming from?
The MBA report identifies 12 classes of lenders who supply funds to the multifamily mortgage market. However, the top 5 classes account for over 97 percent of outstanding multifamily mortgages. This is illustrated in the following chart.
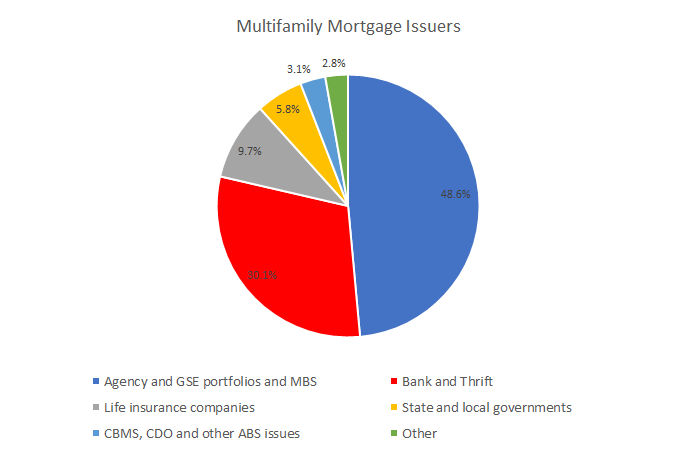
Agency and GSE (government sponsored entity) portfolios and MBS (mortgage backed securities) refer to the likes of Fannie Mae and Freddie Mac and the securities they issue.
Banks and Thrifts (savings and loans) and life insurance companies are self-explanatory.
CMBS (commercial mortgage backed securities), CDO (collateralized debt obligations) and other ABS (asset backed securities) issues refer to securities issued based on pools of mortgages. These instruments were implicated in some of the excesses leading up to the housing bubble and crash in the 2007 to 2010 time frame and have become less prominent since then.
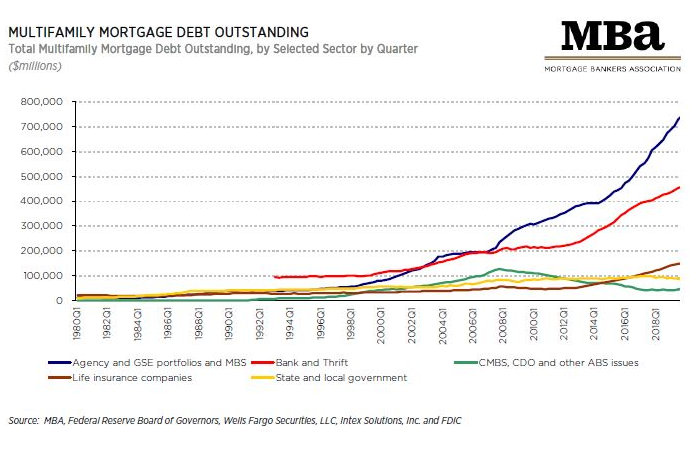
The final chart, also taken from the MBA report shows the levels of multifamily mortgage debt outstanding from the principal sources over time. The key take-away from this chart is that the GSE’s have become the largest source of funding of mortgages on multifamily properties, particularly since the housing bubble burst. Reform of the GSE’s has been a topic of discussion in Congress in recent years. If it happens, the shape of the reform could have an impact on funding availability of mortgages for multifamily properties and so it is something that investors in multifamily properties should take an interest in.
The full report also includes information on the entire commercial property mortgage market. This encompasses property types such as retail, office, hospitality and industrial. The full report can be found here.


