

CoStar recently released a report on the change in value of commercial property in the United States. It says that multifamily property values continue to increase faster than those of other commercial property types.
A basis for comparison
The CoStar report focuses on a relative measure of property values called the CoStar Commercial Repeat Sales Index (CCRSI). This index is computed based on the resale of properties whose earlier sales prices and sales dates are known. The index represents the relative change in the price of property over time rather than its absolute worth.
By focusing on repeat sales rather than all sales, the index compensates for the effects of potentially comparing the sales of properties with different characteristics in different time periods. However, by only using repeat sales, the number of transactions that can be used to calculate the index in any time period is reduced. In March 2020, there were 831 sales pairs for all of the property types tracked by CoStar. This is down from a level of 1,303 sales pairs in March 2019 and is an indication that some investors may be waiting to assess the full impact of the COVID-19 epidemic before moving forward with deals.
How does multifamily stack up?
The first chart shows how multifamily property values have changed over time relative to the values of other primary commercial property types CoStar tracks. The data is normalized so that the index values for all property types are set to be 100 in December 2000. The change in the value of the index since then shows how the relative value of that property type has changed.
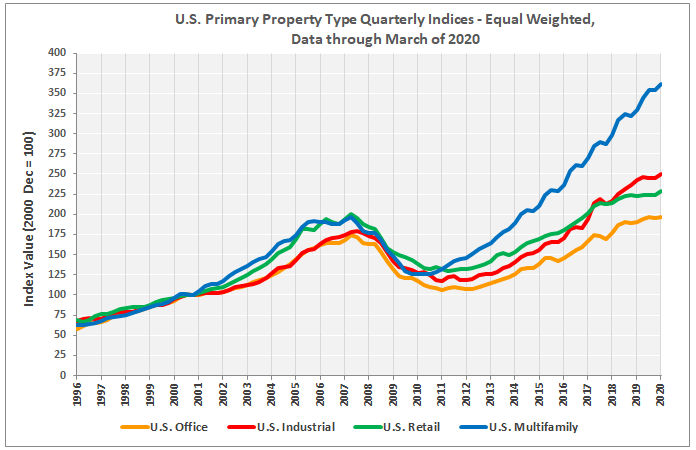
The chart shows that multifamily property values have risen faster than those of office, industrial or retail property, particularly since the recovery from the recent downturn began around 2010. In the last 12 months, multifamily property values have risen by 9.8 percent based on the equal weighted index, well above the 3.4 percent increase in office property values. However, this increase is well behind the 17.4 percent increase in the index for land.
Regional differences
The next chart shows how the CoStar multifamily price indices for the four Census regions of the United States have changed since 2000. As before, each of the indices is normalized to a value of 100 in December 2000, and the chart shows the relative change in value since then. Having a higher index value does not necessarily mean that the value of the property in dollars per door or dollars per square foot is higher.
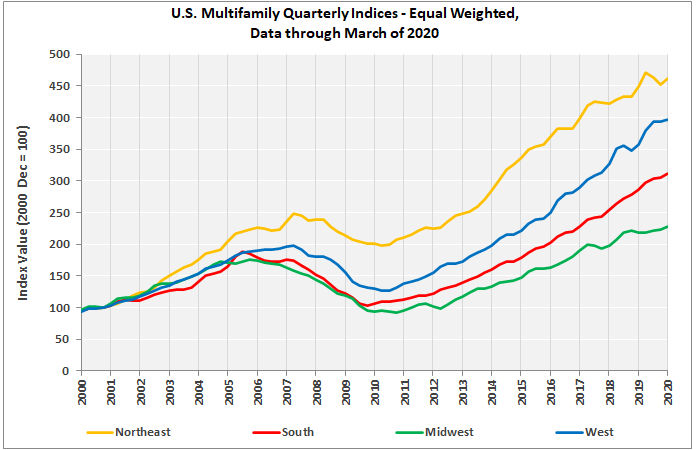
The chart shows that the Northeast has been the region with the strongest appreciation in multifamily property values since December 2000, with prices rising by 361 percent since then. The West was next in line with a rise of 297 percent followed by the South with a rise of 211 percent. The Midwest has had the lowest property value appreciation with prices rising by only 120 percent.
Compared to year-earlier levels, prices were up by 11.1 percent in the West, 8.3 percent in the South, 4.5 percent in the Midwest and 2.9 percent in the Northeast when comparing the equal weighted indices.
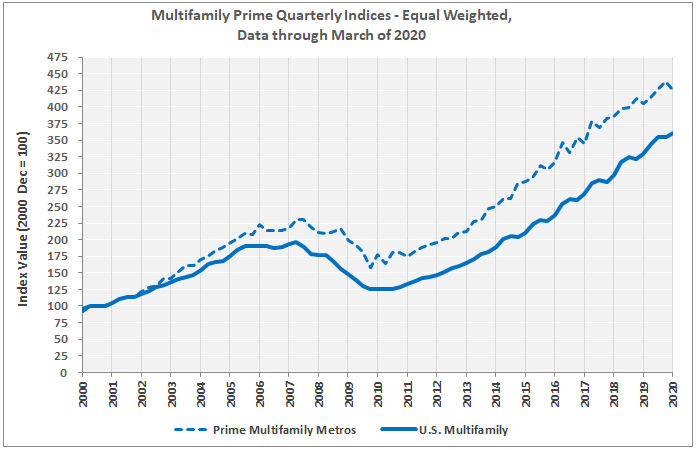
According to the CoStar report, “Capital continued to move down the risk spectrum, as secondary markets experienced stronger pricing gains. The Prime Multifamily Metros Index increased at a slower rate of 5.3 percent in the 12-month period ending in March 2020.” A chart showing the long-term performance difference between prime multifamily markets and multifamily for the country as a whole is shown below.
A look at land
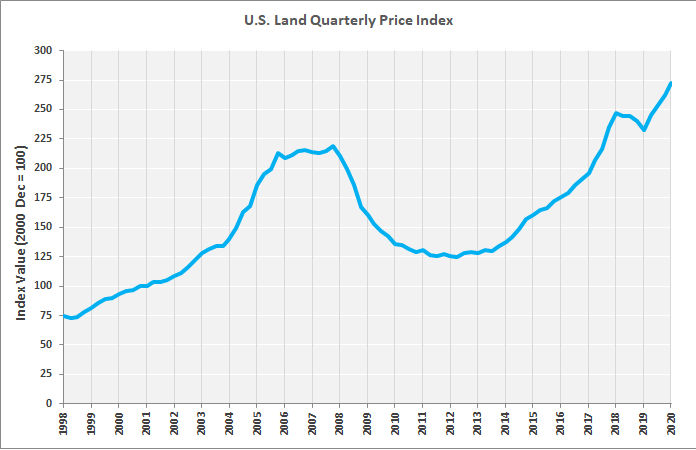
The final chart shows the CCRSI for land. Since December 2000, land has increased in price faster than any of the primary commercial property types except for multifamily.
The full report can be found here.


