

The Bureau of Labor Statistics (BLS) recently released its Job Openings and Labor Turnover (JOLT) report for March. It is the first report to cover a period of time when the reaction to the COVID-19 epidemic had a major impact on the jobs market.
The big picture
The one item of good news in the BLS report is that there were still 6.2 million job openings, both private sector and government, at the end of March. This number is down by 813,000 jobs from last month and represents 3.9 percent of the labor force. However, with many businesses shut down, it is not clear how much hiring is going on. Next month’s report will provide some insight into that.
Total separations in March came in at 14.5 million, a record. Separations are broken into three categories: involuntary separations (layoffs and discharges), voluntary separations (quits) and other separations (retirements, etc.). Every month, there is a significant amount of churn in the labor force with people leaving old jobs and finding new ones. Last month, total separations were 5.6 million while hires were 5.2 million. While total separations in March were up by 8.9 million, the number of voluntary separations was down by 654,000 to 2.8 million.
The first chart, below, shows the long-term trends in the non-farm jobs market. The number of job openings shows the most variation. The reduction in job openings around 2003 was caused by the twin shocks of the dotcom bubble bursting and the 9/11 terrorist attacks. The reduction in the 2009 time frame was caused by the bursting of the housing bubble and the subsequent financial crisis. While there was a rise in total separations (layoffs) in 2009, the level of layoffs was remarkably stable for most of the period covered by this chart. Until now.

Construction jobs also hit
The tight labor market for construction workers has been the bane of multifamily housing builders for several years. The second chart, below, shows the long term trends in the construction jobs market as tracked by the BLS. Because of the smaller number of jobs involved, the data is “noisier” with much more pronounced short-term variations in the data. However, the general shapes of the curves follow those for the labor market as a whole. It is notable that the March jump in the number of layoffs for construction jobs was about three times its recent monthly average while the jump in the number of layoffs for the entire non-farm jobs sector in March was over 6 times its recent monthly average.

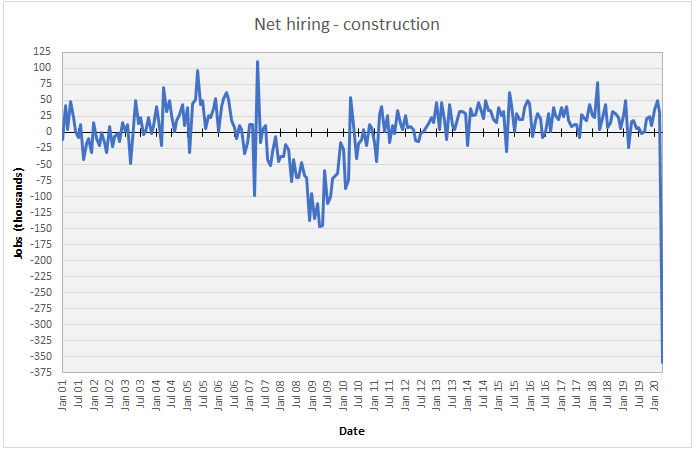
The last chart shows the net hiring of construction workers over the last 19 years. This is the difference between the total number of hires and the total number of separations. It shows that the job losses after the housing bubble burst hit construction workers hard. It took years for construction employment to return to its pre-crash level. It is possible that the current job losses are due to construction sites being temporarily shut down and that the jobs may quickly return once things open up again. However, if builders and developers go out of business or decide to put their projects on hold, construction employment may take another long-term hit.
The numbers given in the JOLT report are seasonally adjusted and are subject to revision. It is common for small adjustments to be made in subsequent reports, particularly to the data for the most recent month. The full current report from the BLS can be found here.


