

A Mortgage Bankers Association (MBA) report on mortgage originations shows that, while multifamily mortgage originations fell in the latest quarter, they held up better than did originations for other commercial property types.
Setting a baseline
The report presents data on the mortgage Origination Volume Index. The index is defined as the ratio of the current mortgage origination volume to the average quarterly volume in 2001. The average quarterly volume in 2001 is defined as an index value of 100. Therefore, if the mortgage origination volume doubled since 2001, the index would be reported as 200.
The first chart shows both the multifamily mortgage origination volume index and also the mortgage origination volume index for the entire commercial property market. It is clear from the chart that the volume of multifamily mortgage originations has a strong periodic character. For the last several years, mortgage origination volume has risen in each quarter of the year and then has fallen back in the first quarter of the next year. However, each subsequent year has seen origination volume rise.
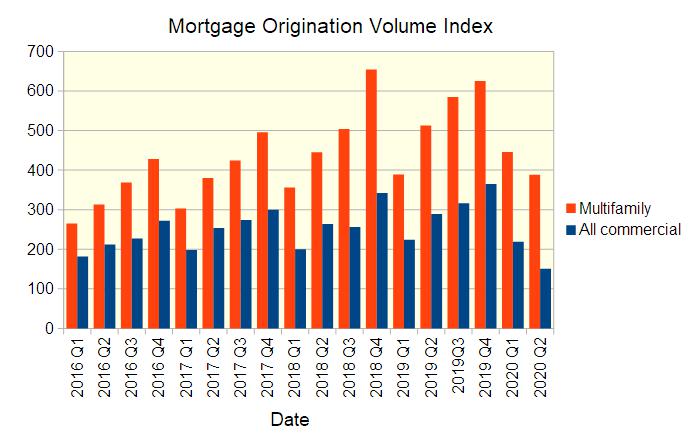
In 2020, the pattern seemed poised to repeat, with multifamily mortgage originations up by 15 percent in Q1 compared to Q1 2019. Then the shutdowns in response to COVID-19 began.
Multifamily mortgage origination volume in Q2 2020 was down 13 percent from Q1. By contrast, in each of the last three years, volume had grown by 25 percent or more from Q1 to Q2. Compared to Q2 2019, multifamily mortgage origination volume was down by 24 percent.
As bad as this performance seems, it is good compared to other commercial property types. The next strongest sector for mortgage originations was health care, where origination volume fell 40 percent from year-earlier levels. The worst performing sector was hotels, where mortgage origination volume fell 91 percent.
Who is lending?
The MBA report also includes mortgage origination indices for several classes of lenders. These are based on the dollar volumes of mortgages originated. Not surprisingly, they were all down for Q2 2020 when compared to the same quarter the year before.
The largest drop in lending occurred for collateralized mortgage backed securities (CMBS)/conduits. Mortgage originations from this source were down by 95 percent when compared to year-earlier levels. Commercial banks reduced originations by 55 percent, while life insurance companies reduced originations by 49 percent.
The sources of funds whose lending held up the best were the government sponsored entities (GSEs), Fannie Mae and Freddie Mac. Their mortgage origination volume only fell by 5 percent.
The full report also includes information on the entire commercial property mortgage market. This encompasses property types such as retail, office, hospitality and industrial. The full report is called Quarterly Originations Index and can be found here.


