

RealPage recently presented their student housing fall market update. It reported that rent growth and occupancy numbers are below what has been seen in recent years but they are not as bad as some had feared.
How things are shaping up
The student housing market is being roiled by the fallout from the COVID-19 pandemic. While this situation is still evolving, RealPage presented a snapshot of where the market is at this time. The presentation was conducted by Greg Willett, Chief Economist, and Carl Whitaker, Manager, Real Estate Economist at RealPage. It was based on information collected from the 175 colleges and universities that RealPage tracks.
Whitaker reported that, as of August, leased occupancy for the fall term was at 87.7 percent. This was down from the 91.4 percent reported at the same time last year and from 93.3 percent reported in Fall 2018. However, this may not be the final occupancy figure for the fall term since some students waited until the last minute to decide on housing and others abandoned their reservations at the first sign of a COVID outbreak on campus.
Looking back, RealPage showed data indicating that the leasing season for the fall 2020 term had gotten off to a strong start last year, with lease signings running ahead of the year-earlier levels through February. Once COVID emerged in March, signings slowed significantly, not approaching year-earlier levels until July. This resulted in the deficit reported.
Your results may vary
A recurring theme of the presentation was that results for individual schools may be quite different than the national averages. In fact, many of the factors studied had a “barbell” distribution, with many schools being either well above or well below the national average, with relatively few schools around the average.
The first chart RealPage presented that exhibited this distribution of results is repeated below. It shows the distribution in the percentage of available beds at each school which were leased as of August. The tallest bars on the chart are for schools achieving over 95 percent lease rates, at 28 percent of schools, and for schools achieving less than 80 percent lease rates, at 24 percent of schools. Only 17 percent of schools were near the national average of 87.7 percent occupancy, as shown by the center bar.
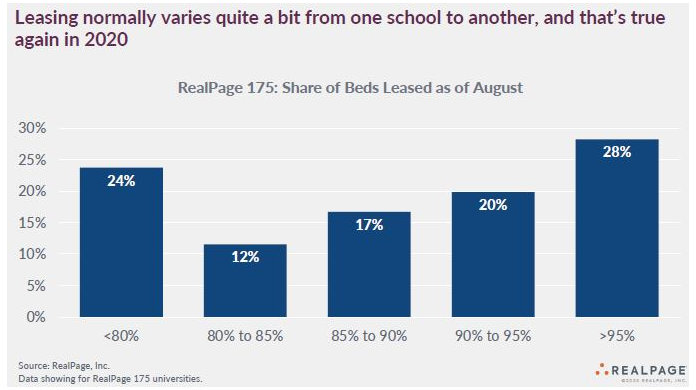
Compared to year-earlier results, 64 percent of schools reported a decline in the percentage of their beds which were leased as of August while 33 percent reported an increase.
By geographic region, the Southeast and the Midwest had a high number of schools with leasing rates above 95 percent. These schools tended to be ones where there was significant population growth taking place or ones where the inventory of purpose-built off-campus student housing was limited.
California was notable for the number of schools where the lease up of student housing was lagging. This was attributed to the schools announcing early on that they would be holding most or all of their classes on-line. Other schools with low portions of available beds leased tended to be ones where student housing had been overbuilt or ones where the enrollment of the school was either stagnant or in decline.
Average rents still rise
Perhaps surprisingly, asking rents at the RealPage 175 schools are up 1.4 percent from last year, but this increase is less than in recent years. By contrast, fall term rents in 2019 were up 1.7 percent from year earlier levels and fall 2018 rents were up 2.2 percent from fall 2017.
A timeline of effective asking rent changes showed that price growth was more in line with prior years until March. From that point, price increases slowed significantly.
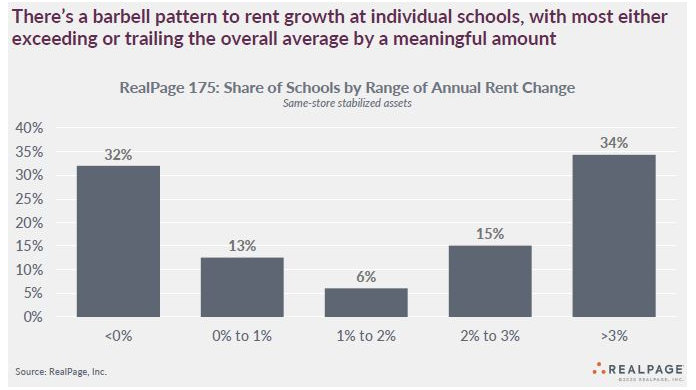
The next chart, reproduced below, shows the percentage of schools achieving a given rent growth range. It again has a barbell distribution with 34 percent of schools achieving rent growth above 3 percent and 32 precent of schools experiencing rent declines. The remaining schools were somewhere in the middle.
Ten schools achieved rent growth above 6 percent in 2020, with Texas Christian University and Mississippi State University achieving rent growth above 8 percent. Enrollment growth and/or limited local supply of housing were cited as factors in these results.
Several California schools were on the list of those experiencing the largest rent declines. This was attributed to high local rents and an early commitment to distance learning. Abundant new supply and/or declining enrollment were also often cited as factors contributing to falls in rent levels at individual schools.
Pricing influences
Willett pointed out that communities that are closer to campus achieve a significant rent premium, on average. The average rent at communities within one-half mile of campus is $749. The average rent at communities located between 0.5 and 1 mile of campus falls to $611. Communities more than 1 mile from campus only achieve average rents of $575.
RealPage reported that 51,000 new beds were delivered in time for the fall 2020 term. This was in line with the prior 5 years where deliveries ranged from a high of 56,000 beds to a low of 49,000 beds. The new supply was not evenly distributed, with 16 campuses seeing deliveries of over 1,000 beds for 2020. These 16 campuses represent 9 percent of the campuses tracked by RealPage but they accounted for 47 percent of new beds delivered. The leading school, the University of Florida, alone saw 3,317 new beds delivered.
For fall 2021, RealPage expects deliveries to drop to around 39,000 new beds. The greatest number of deliveries is expected to be at the University of Texas at Austin with 2,343 beds. Number two is expected to be the Georgia Institute of Technology with 1,998 beds.
As was mentioned above, a school’s enrollment growth or decline is a significant factor in driving occupancy and rent growth. Because of this, a school’s acceptance rate can be an indicator of how vulnerable a school is to future enrollment declines. A school turning away a high portion of applicants can adjust its admissions criteria in order to sustain enrollment in the face of declining applications. A school accepting most applicants does not have the same flexibility.
RealPage presented a chart, reproduced below, showing the distribution of acceptance rates for the 175 schools they track. Schools with acceptance rates of 70 percent or less are positioned to sustain their enrollments even when applications decline.
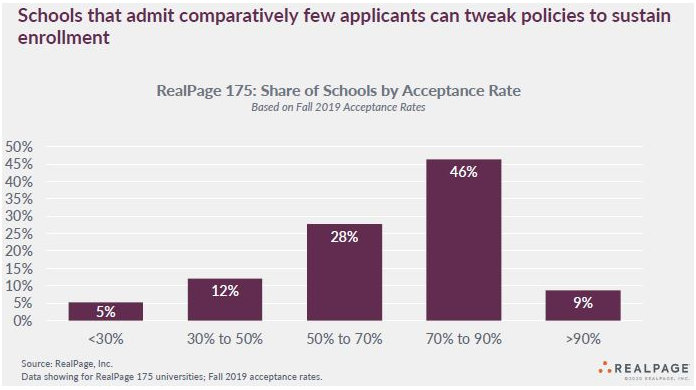
RealPage’s figure of 9 percent for the portion of schools accepting more than 90 percent of applicants implies that 16 of their 175 schools fall into this category. However, they presented a list of schools with unusually high acceptance rates which only included 4 names of schools with rates above 90 percent. They were Western Kentucky University (97 percent), Middle Tennessee State University (94 percent), University of Kansas (93 percent) and Iowa State University (92 percent).
In response to a question about enrollment levels, Whitaker cited a study that reported enrollment in 2020 was down by 2 to 3 percent from last year. The study indicated that community colleges were harder hit by declining enrollment than 4 year schools.
The full presentation runs about 30 minutes. It can be found here.


