

A pair of reports, one from Yardi Matrix and one from Apartment List, track changes in rents charged across the country. The reports show rents declining slightly for the country as-a-whole. However, they both show a wide variation in results for different metro areas.
Rents down in November
Yardi Matrix reported that the national average apartment rent in November was unchanged from the month before while Apartment List reported that the national average rent fell 0.5.
On a year-over-year basis, Yardi Matrix reported that rents fell 0.5 percent nationally. However, they noted that rents were actually up for 100 of the 130 markets that they track. A few big losing markets are pulling down the overall average.
Apartment List reported that rents were down 1.3 percent nationally year-over-year.
The last shall be first and the first last
Both reports note once again this month that there are wide variations in rent growth between different markets. Both reports point out that the cites that have seen the largest year-over-year declines in rents are often high-priced coastal “gateway” cities. These are the cities that have been among the leaders in rent growth in recent years.
Not all of the results in the two reports can be directly compared because of the way that the metro areas are defined. For example, Yardi Matrix treats Los Angeles and Orange County as separate metros while Apartment Lists reports on them separately. By focusing on smaller geographic regions, the Apartment List report is prone to finding more extreme variations in rents than is the Yardi Matrix report, which averages rents over broader regions.
The metros with the largest annual rent declines as ranked by Yardi Matrix are given in the table, below, along with the annual rent changes given for the metros in the two reports.
| Metro |
Yardi Matrix |
Apartment List |
| San Jose |
-11.0 |
-11.7 |
| San Francisco |
-8.6 |
-25.5 |
| Seattle |
-4.4 |
-8.2 |
| Austin |
-4.1 |
-5.6 |
| Washington DC |
-3.9 |
-13.6 |
| Chicago |
-3.4 |
-9.3 |
| Boston |
-3.3 |
-18.7 |
| Los Angeles |
-2.9 |
-8.1 |
| Orlando |
-2.8 |
-4.9 |
| Nashville |
-1.8 |
-3.7 |
The major metros with the largest year-over-year rent increases as determined by Yardi Matrix are listed in the next table, below, along with the rent increases given for the metros in the two reports.
| Metro |
Yardi Matrix |
Apartment List |
| Inland Empire |
6.6 |
8.4* |
| Sacramento |
5.9 |
2.9 |
| Phoenix |
4.3 |
3.9 |
| Indianapolis |
3.9 |
3.1 |
| Las Vegas |
3.4 |
5.1 |
| Tampa |
3.4 |
2.1 |
| Baltimore |
3.3 |
1.6 |
| Atlanta |
2.7 |
1.7 |
| Kansas City |
2.4 |
0.3 |
| Philadelphia |
2.4 |
5.2 |
*Ontario
The COVID effect
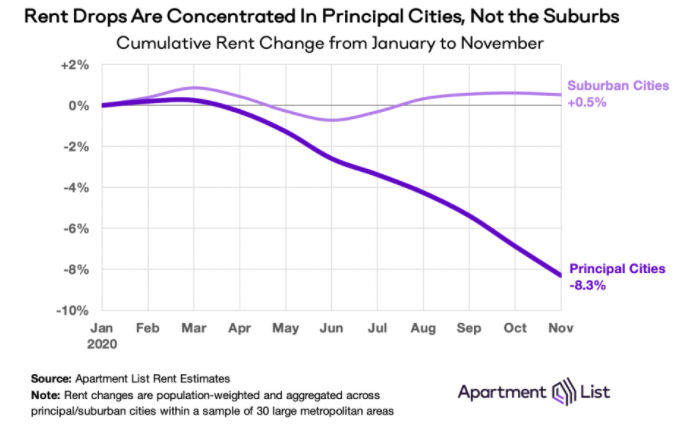
While the COVID-19 pandemic continues, along with the lock-down orders and office closures in reaction to it, it is the primary driver in the market. Both reports note that the increasing time at home has driven the desire for more living space. Both state that the ability to work remotely has increased geographical flexibility when selecting a home. These two effects have put pressure on rents in the core cities while increasing demand in more outlying areas. The results of these pressures are illustrated in the following chart, reproduced from the Apartment List report. It shows how rents have been falling in the core cities while they have held steady in the suburbs.
Yardi Matrix points out that the effects from the pandemic play to the strengths of the single family rental (SFR) industry. SFR properties provide more space than is available in a typical multifamily community and their location in the suburbs becomes less of a negative if an employee can work remotely most of the time. They expect these homes to become more attractive to renters looking for more space, but who are unwilling or unable to buy.
The complete Yardi Matrix report discusses some of the smaller multifamily housing markets. It has more information about the larger markets including numbers on job growth, completions of new units and occupancy rates. It also includes charts showing the history of rent changes in 18 of the top 30 markets over the last 4 years. It can be found here.
The complete Apartment List report covers many more metros and provides readers with the opportunity to download their data sets. It can be found here.


