

The latest rent reports from Yardi Matrix and Apartment List continue to show declining rents for the country as-a-whole. However, they both also show wide variations in results between different metro areas.
Rent slide continues in December
Yardi Matrix reported that the national average apartment rent fell $4 (0.3 percent) in December to $1,462. This was down 0.8 percent from its year-earlier level. Apartment List reported that the national average rent fell 0.4 percent for the month of December and was down 1.5 percent from its year-earlier level.
It is not unexpected that rents would fall in December. The winter months are the slow time of the year for rental activity and rents are often soft during that time. However, this year has been anything but typical as is illustrated in the first chart, which is taken from the Apartment List report.
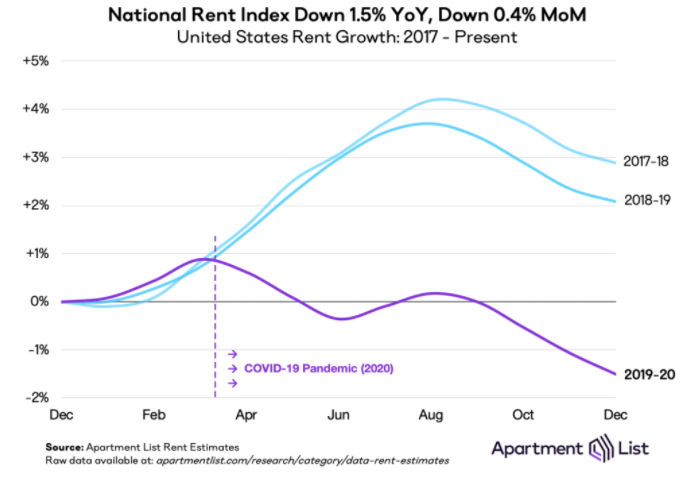
The chart shows how COVID-19 related shutdowns put pressure on rents during the spring, which is the time when rents start to increase during a normal year. However, in 2020, rents fell during the spring before rebounding slightly in late summer when the economy began to reopen. Tightening shutdowns in the fall, along with normal seasonality, caused rents to decline again late in the year.
Differences between metros widen
Both reports note once again this month that there are wide variations in rent growth between different markets. Both reports point out that the cites that have seen the largest year-over-year declines in rents are often high-priced coastal “gateway” cities. These are the cities that have had some of the highest rents in the country in recent years.
The metros with the largest annual rent declines as ranked by Yardi Matrix are given in the first table, below, along with the annual rent changes listed for the metros in the two reports.
| Metro |
Yardi Matrix |
Apartment List |
| San Jose |
-13.7 |
-15.3 |
| New York |
-11.7 |
-7.6 |
| San Francisco |
-9.4 |
-15.0 |
| Seattle |
-6.2 |
-10.6 |
| Washington DC |
-4.9 |
-7.9 |
| Boston |
-3.7 |
-12.6 |
| Austin |
-3.6 |
-4.5 |
| Los Angeles |
-3.0 |
-3.9 |
| Chicago |
-2.9 |
-6.0 |
| Orlando |
-2.7 |
-3.6 |
The major metros with the largest year-over-year rent increases as determined by Yardi Matrix are listed in the next table, below, along with the rent increases given for the metros in the two reports.
| Metro |
Yardi Matrix |
Apartment List |
| Inland Empire |
7.3 |
10.0* |
| Sacramento |
6.1 |
6.8 |
| Phoenix |
4.6 |
4.5 |
| Tampa |
3.9 |
3.6 |
| Las Vegas |
3.8 |
5.0 |
| Indianapolis |
3.5 |
3.5 |
| Baltimore |
3.3 |
2.3 |
| Atlanta |
3.0 |
2.5 |
| Philadelphia |
2.4 |
-0.4 |
| Charlotte |
2.2 |
0.2 |
*Riverside-San Bernardino-Ontario
The great reshuffle continues
The COVID-19 pandemic continues, along with the lock-down orders and closures in reaction to it, to be the primary driver changing the housing market. This has caused an increasing divergence in rent growth between metros as renters’ location preferences change in response to the new environment. For example, the difference in annual rent changes for the major metro with the highest rent growth in the Yardi Matrix report for December 2020 (Inland Empire +7.3 percent) and that with the lowest rent growth (San Jose -13.7 percent) is 21 percent. In the December 2019 report, the difference between the highest (Phoenix +7.7 percent) and lowest (San Jose -0.3 percent) ranking metros for rent growth was only 10 percent. COVID-19 has widened the performance gap between metros and also between urban cores and their surrounding areas.
The complete Yardi Matrix report discusses some of the smaller multifamily housing markets. It has more information about the larger markets including numbers on job growth and completions of new units. It also includes charts showing the history of rent changes in 18 of the top 30 markets over the last 4 years. It can be found here.
The complete Apartment List report covers many more metros and provides readers with the opportunity to download their data sets. It can be found here.


