

The latest rent reports from Yardi Matrix and Apartment List show positive rent growth for the country as-a-whole in January.
Rents rise in January
Yardi Matrix reported that the national average apartment rent rose $3 (0.2 percent) in January to $1,392. This was down 0.2 percent from its year-earlier level. Apartment List reported that the national average rent rose 0.1 percent for the month of January but was down 1.2 percent from its year-earlier level.
Close observers may have noted that the average rent quoted by Yardi Matrix last month was $1,462, which is not $3 less than $1,392. The reason for this discrepancy is that Yardi Matrix has now expanded the number of metros that they look at in calculating rents. They now look at 130 metros. The new calculation appears to have brought in smaller, less expensive metros and this has resulted in a lower national average rent calculation result.
January is a transition month between the sluggish rent growth or outright declines in the fall, to the positive rent growth in the spring of a typical year. Apartment List reports that rents were flat in January 2018 and down 0.1 percent in January 2018, before rising this year. This is show in the chart, below, reproduced from the Apartment List report.
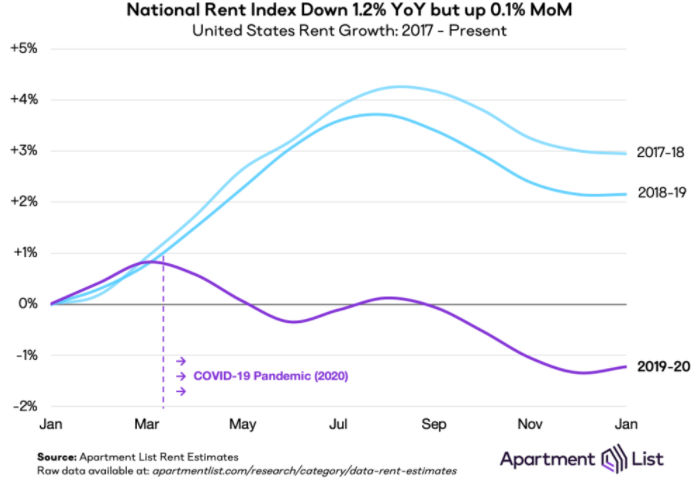
The chart shows the January-to-January pattern of changes in the national average rent over the past 3 years. The effect of the COVID-19 pandemic on rents is clearly visible in the 2019-20 curve after March. The uptick in January 2021 rents may foretell better times for apartment operators this year.
Differences between metros shrink
While both reports note that there are wide variations in rent growth between different markets, both reports also note that these differences were smaller this month. The rates of rent declines in many of the high-priced coastal “gateway” cities seem to have slowed down. At the same time, the rates of rent increases in some of the “secondary” markets that were gainers in 2020 have also declined. While this may not be immediately apparent from looking at the annual rent change numbers, an examination of the monthly rent numbers for the 52 largest metros listed in the Apartment List data set shows that the spread between the metros with the highest and lowest monthly rent changes dropped from 3.3 percent in December to 1.9 percent in January.
The metros with the largest annual rent declines as ranked by Yardi Matrix are given in the table, below, along with the annual rent changes given for the metros in the two reports.
| Metro |
Yardi Matrix |
Apartment List |
| San Jose |
-13.0 |
-15.1 |
| New York |
-12.2 |
-8.5 |
| San Francisco |
-9.8 |
-15.4 |
| Seattle |
-7.1 |
-11.7 |
| Washington DC |
-4.5 |
-7.3 |
| Boston |
-3.8 |
-11.8 |
| Los Angeles |
-3.0 |
-4.1 |
| Chicago |
-3.0 |
-5.9 |
| Austin |
-2.7 |
-4.1 |
| Orlando |
-2.6 |
-3.3 |
The major metros with the largest year-over-year rent increases as determined by Yardi Matrix are listed in the next table, below, along with the rent increases given for the metros in the two reports.
| Metro |
Yardi Matrix |
Apartment List |
| Inland Empire |
7.4 |
10.0* |
| Sacramento |
6.3 |
6.8 |
| Indianapolis |
4.5 |
4.5 |
| Phoenix |
4.3 |
3.6 |
| Baltimore |
3.9 |
5.0 |
| Las Vegas |
3.8 |
3.5 |
| Tampa |
3.6 |
2.3 |
| Atlanta |
3.1 |
2.5 |
| Philadelphia |
2.7 |
-0.4 |
| Charlotte |
2.2 |
0.2 |
*Riverside-San Bernardino-Ontario
Driving the change
Early on in the pandemic, Yardi Matrix took a stab at predicting which metros were most at risk of rent declines due to COVID-19. They based their predictions on how exposed the various markets were to job losses resulting from the COVID-inspired shutdowns. Metros with a high percentage of jobs at risk were expected to have a higher probability of rent declines. Looking back, Yardi Matrix found that it did not work out that way. Some states with a large percentage of at-risk jobs pushed aggressively to reopen their businesses and that mitigated the job losses. Instead, Yardi Matrix found that high-cost metros with strong out-migration were the hardest hit as falling occupancy led to rent cuts.
Another factor, not mentioned in the Yardi Matrix report, which may have impacted how the apartment market was affected by the pandemic is the widespread moratoria on evictions. Their widespread application and repeated extensions may have kept people who lost their jobs in apartments that they otherwise would have been forced to leave. This would tend to support occupancy, if not NOI, and may help explain why some markets expected to be hard-hit, like Las Vegas, have actually seen rent growth.
The complete Yardi Matrix report discusses some of the smaller multifamily housing markets. It has more information about the larger markets including numbers on job growth and completions of new units. It also includes charts showing the history of rent changes in 18 of the top 30 markets over the last 4 years. It can be found here.
The complete Apartment List report covers many more metros and provides readers with the opportunity to download their data sets. It can be found here.


