

Recent reports from CoStar and from Real Capital Analytics (RCA) show that multifamily property values continued to rise in January.
Defining the indices
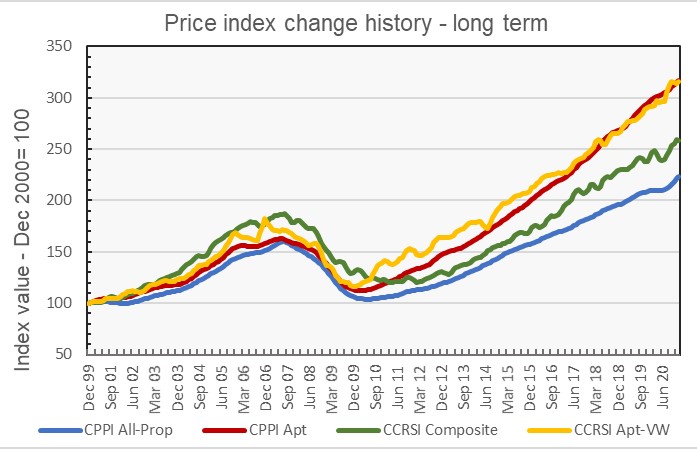
The CoStar report focuses on a relative measure of property values called the CoStar Commercial Repeat Sales Index (CCRSI). Real Capital Analytics calls their equivalent measure the Commercial Property Price Index (CPPI). Both indices are computed based on the resale of properties whose earlier sales prices and sales dates are known. The indices represent the relative change in the price of property over time rather than its absolute price.
Multifamily prices rising
RCA reported that apartment prices in January were 6.8 percent higher than their levels one year ago. This compares to a 6.9 percent annual increase for all commercial property types and an 8.3 percent annual increase for industrial property. RCA found that prices for properties in the retail sector in October were 1.8 percent lower than their levels of a year ago while office prices were up 3.3 percent in that time.
CoStar reported that its value-weighted index of multifamily property prices increased 0.5 percent in January from its level in December. The index was 8.5 percent higher than its level in January 2020. By comparison, the composite index for all commercial property types was down 0.2 percent for the month but up 7.0 percent from its year-earlier level.
The history of the CCPIs and CCRSIs for commercial properties and for multifamily as asset classes is shown in the first chart, below.
Transaction volume still down
While they did not break out transaction volume by commercial property type, CoStar included information on overall commercial property sales transaction on properties for which they have purchase information. CoStar found that the volume of transaction-pairs in the 12 months ending in January 2021 was down 20 percent from that of the 12 month period ending in January 2020.
CoStar studies other transaction statistics to discern trends in market liquidity. The report noted that the number of days on market has been increasing, which is a sign of decreasing liquidity. However, days on market is still relatively low by historical standards, as is shown in the chart reproduced from the report below.
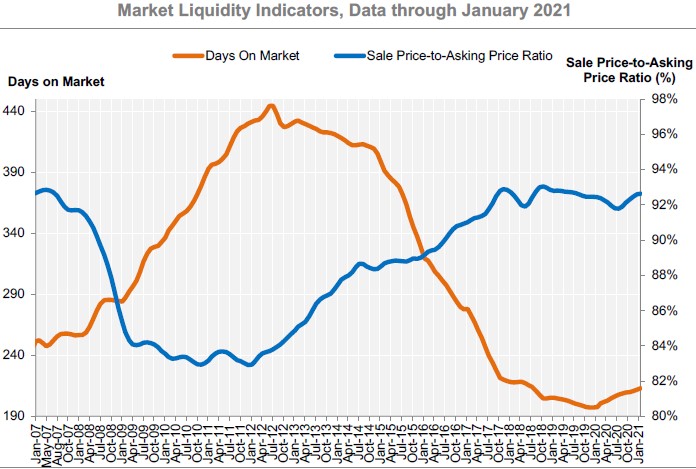
The sales price to asking price ratio is relatively strong and has been rising in recent months. CoStar also reports that distressed sales as a portion of all sales remains low at 2 percent. This is in line with its recent history and much below the levels it reached in 2010 and 2011, when distressed sales often exceeded 30 percent of all sales.
The full CoStar report can be found here. The RCA report can be found here.


