

The latest rent reports from Yardi Matrix and Apartment List show positive rent growth for the country as-a-whole in February.
Rents rise in February
Yardi Matrix reported that the national average apartment rent rose 0.2 percent in February to $1,399. This was down 0.1 percent from its year-earlier level. Apartment List reported that the national average rent rose 0.7 percent for the month of February but was down 0.8 percent from its year-earlier level.
February is usually the start of the rent growth season and that trend seems to be holding this year. In fact, Apartment List reported that the rate of rent growth this February for the country as-a-whole is nearly twice the average of the last three years. This is show in the first chart, below, reproduced from the Apartment List report.
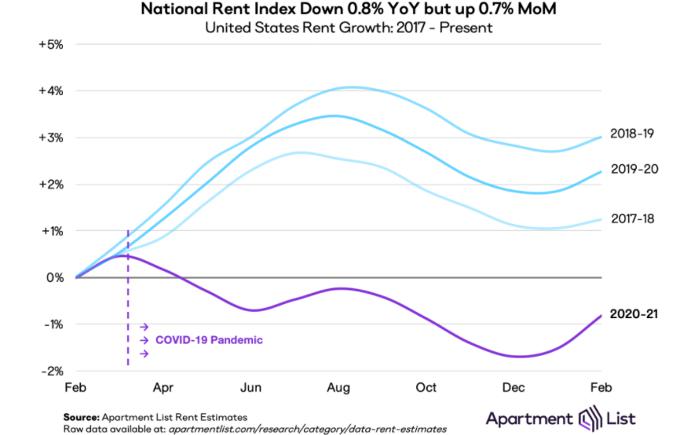
The chart shows the February-to-February pattern of changes in the national average rent over the past 4 years. The negative impact of the COVID-19 pandemic on rents is clearly visible the March to August portion of the 2020-21 curve, where the rent growth season never materialized. So far, the 2021 rent growth season is off to a strong start, although it is still early days.
The names remain the same
The lists of metros with the highest and lowest changes in annual rents remained very similar to those of last month. In fact, the list of 10 metros with the greatest rent declines is unchanged except for the 10th spot. There, Houston edged out Orlando for the dubious honor of being included on the list.
The list of metros with the highest year over year rent growth had the order of the cities shuffled a bit but the only new name on the list was Kansas City, which bumped Charlotte from the list.
According to the Apartment List data, all of the top metros experienced positive rent growth for February. According to Yardi Matrix, only six of the top 30 metros saw rents decline for the month, They were Seattle, San Francisco, New York, San Jose, Washington DC and Boston.
The metros with the largest annual rent declines as ranked by Yardi Matrix are given in the table, below, along with the annual rent changes for the metros in the two reports.
| Metro |
Yardi Matrix |
Apartment List |
| San Jose |
-13.3 |
-15.4 |
| New York |
-13.3 |
-8.0 |
| San Francisco |
-9.9 |
-14.9 |
| Seattle |
-7.7 |
-11.6 |
| Washington DC |
-5.2 |
-6.8 |
| Boston |
-3.5 |
-10.1 |
| Los Angeles |
-2.8 |
-4.1 |
| Chicago |
-2.6 |
-5.5 |
| Austin |
-2.3 |
-3.1 |
| Houston |
-1.2 |
-2.3 |
The major metros with the largest year-over-year rent increases as determined by Yardi Matrix are listed in the next table, below, along with the rent increases given for the metros in the two reports.
| Metro |
Yardi Matrix |
Apartment List |
| Inland Empire |
7.6 |
11.0* |
| Sacramento |
6.4 |
7.1 |
| Phoenix |
6.0 |
5.5 |
| Las Vegas |
5.2 |
5.3 |
| Atlanta |
4.6 |
3.8 |
| Tampa |
3.9 |
4.7 |
| Baltimore |
3.6 |
2.8 |
| Indianapolis |
3.6 |
2.8 |
| Philadelphia |
2.9 |
0.2 |
| Kansas City |
2.3 |
1.0 |
*Riverside-San Bernardino-Ontario
Location matters
Both reports note that the pandemic has caused the formerly high-flying core urban markets to stumble while elevating secondary markets that had previously been backwaters.
The Apartment List report cited the comparison of San Francisco to Boise. Prior to the pandemic, San Francisco had been one of the most expensive rental markets in the country, but rents have recently been falling there. Since the pandemic, Boise has been one of the country’s leaders for rent growth. The result of these changes is that the ratio of San Francisco rents to Boise rents has fallen from 3.4x before the pandemic to 2.2x now. Still significantly different but a big narrowing.
The Yardi Matrix report discusses the impact of the work from home (WFH) trend resulting from the pandemic. The report estimates that the portion of workers regularly using WFH may rise from the pre-pandemic level of 10 percent to as much as 25 percent of the workforce. They predict that this trend may delay the recovery of the urban core areas and boost secondary markets. However, they believe that, post-pandemic, a new generation of college graduates will be drawn to the urban lifestyle, leading to the eventual recovery of the urban core.
The complete Yardi Matrix report discusses some of the smaller multifamily housing markets. It has more information about the larger markets including numbers on job growth and completions of new units. It also includes charts showing the history of rent changes in 18 of the top 30 markets over the last 4 years. It can be found here.
The complete Apartment List report covers many more metros and provides readers with the opportunity to download their data sets. It can be found here.


