

The Census Bureau released its monthly new residential construction report for March 2021. It reported that multifamily housing permits, starts and completions were all strong.
Multifamily housing construction permits down but up
The number of permits issued for buildings with 5 or more units “declined” in March to a still high 508,000 units on a seasonally adjusted, annualized basis. This was reported as a drop only because the number of permits reported for February was adjusted upward by 32,000 units to 527,000 units. Using the revised February figure for comparison, permits were down 4 percent for the month. However, March permits were up 19 percent from the level recorded for March 2020 and were up 18 percent from the average level for the prior 12 months.
In addition, 59,000 permits were issued in March for units in buildings with 2 to 4 units. This was up 25 percent from the revised level of the previous month and was up 28 percent from the number of such permits issued in March 2020.
Regional data for multifamily housing is only reported for structures with two or more units. “Structures with 5 or more units” is not broken out as a separate category. Since the regional data is highly volatile and is frequently revised, it is examined here based on three-month moving averages. This averaging will tend to smooth out the variations in the data.
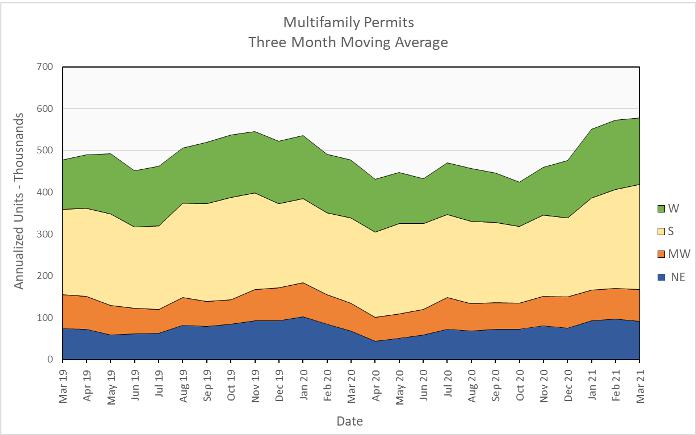
Nationally, the three-month weighted moving average for permits issued for multifamily housing in March was up 1 percent from the very strong level of February and was 21 percent higher than the level of March 2020. Permit issuance history is shown in the first chart, below. The three-month weighted moving average for permits came it at 578,000 units.
On a month over month basis, the three-month weighted moving average for permit issuance was up 6 percent in the South and 4 percent in the Midwest. It fell 4 percent in the West and 5 percent in the Northeast.
When compared to year-earlier levels, the three-month weighted moving average of permits issued was up 33 percent in the Northeast, 23 percent in the South and 15 percent in both the West and the Midwest.
The following chart shows the three-month weighted moving averages of permits by region for the last 25 months.
Multifamily housing construction starts rebound
The preliminary figure for multifamily housing starts in buildings with 5 or more units in March was 477,000 units on a seasonally adjusted, annualized basis. This is up 30 percent from the revised February level. The reported level of January starts was again adjusted sharply upward this month, rising another 42,000 units to 477,000 units. However, February 2021 starts were revised down slightly, falling 5,000 units to 367,000 units. Compared to March 2020, multifamily housing starts in buildings with 5 or more units were up 27 percent.
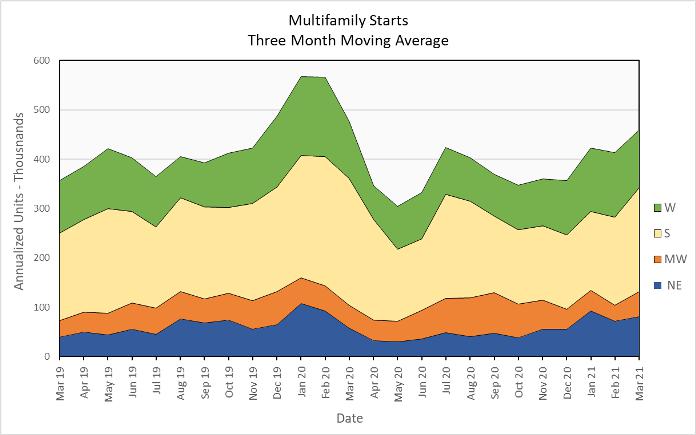
Multifamily housing construction starts (two or more units per building) in March were up 11 percent from their February level for the country as-a-whole, based on three-month weighted moving averages. Starts were up 59 percent in the Midwest, 18 percent in the South and 13 percent in the Northeast. Starts fell 10 percent in the West from the previous month.
The three-month weighted moving average of starts was down 4 percent for the country-as-a-whole on a year-over-year basis. Compared to March 2020, starts were up 39 percent in the Northeast, 11 percent in the Midwest and 1 percent in the West. Starts fell 18 percent in the South.
The following chart shows the starts by region for the last 25 months.
Multifamily housing completions explode
Multifamily housing unit completions in buildings with 5 or more units per building jumped 58 percent from February’s revised level, although that figure was adjusted down by 13,000 units. The preliminary reading on March completions came in at 476,000 units on a seasonally adjusted, annualized basis. Compared to March 2020, multifamily housing completions in buildings with 5 or more units per building were up 30 percent. Compared to the trailing 12-month average, completions were up 33 percent.
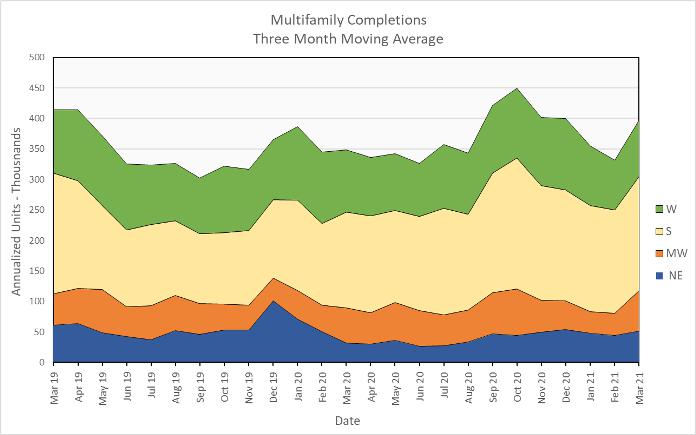
For the country as-a-whole, multifamily housing construction completions (two or more units per building) were up 20 percent month-over-month, comparing three-month weighted moving averages. The three-month weighted moving averages of completions were up 83 percent in the Midwest, 16 percent in the Northeast, 13 percent in the West and 10 percent in the South.
On a year-over-year basis, the three-month weighted moving average of completions in buildings with 2 or more units per building was up 14 percent nationally. Completions were up 60 percent in the Northeast, 20 percent in the South and 15 percent in the Midwest. Completions fell 11 percent in the West.
Completions by region for the past 25 months are shown in the chart below.
All data quoted are based on seasonally adjusted results and are subject to revision.
Starting in February 2021, the calculation of the moving average was changed to put more weight on the current month and progressively less weight on the two prior months. Previously, all three months were weighted equally in calculating the moving average.


