

A report from the Mortgage Bankers’ Association (MBA) says that originations of multifamily mortgages were down in Q1 compared to the same quarter in 2020.
Multifamily mortgage lending down
The first chart, below, shows the quarterly origination volume indices for both commercial mortgages and for multifamily mortgages as reported by the MBA. The indices are reported relative to the year 2001, with the average quarterly volume in that year defined as a value of 100.
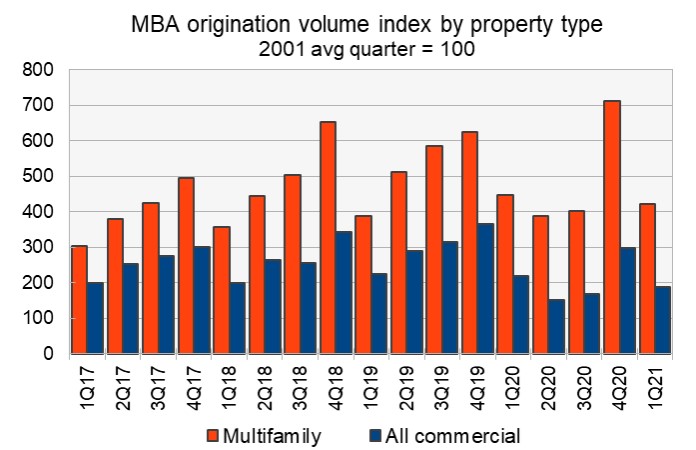
The pattern for the last several years was for the rate of originations to rise throughout the year and then to drop back down in the first quarter of the next year. However, for the years represented in the chart, the origination volume in Q1 of each year was higher than that of the same quarter of the year before. That pattern was broken this year when the multifamily mortgage origination index in Q1 fell 5.2 percent from the level in Q1 2020.
Compared to Q4 2020, originations in Q1 2021 were down by 40.6 percent. While this is a large drop, it was nearly matched by the Q4 to Q1 drops in 2018-2019 and in 2015-2016.
The MBA originations index for commercial properties as-a-whole was down 14 percent in Q1 2021 compared to Q1 2020. The weakest sector was hotels where lending fell 82 percent. The strongest sector was industrial where lending grew 66 percent.
Compared to Q4 2020, the origination index for commercial properties as-a-whole was down 37 percent in Q1 2021. The origination index was down for all commercial property classes, falling 11 percent for offices and 64 percent for hotels.
All sources lessen originations
The MBA report also includes data on the sources of the mortgages being originated. It provides data on four categories of lenders: commercial mortgage-backed securities (CMBS) and conduits, commercial banks, life insurance companies, and the government sponsored entities (GSEs), Fannie Mae and Freddie Mac. As before, the index values are quoted relative to the average quarterly origination volumes in the year 2001. The index values of different originators cannot be used to compare their absolute levels of mortgage originations since their origination levels in the baseline year of 2001 were different. However, the index values can be compared to see which originators are growing their business and which are not.
The commercial mortgage origination data are displayed in the following chart. All four sources of funds reduced their lending in Q1 2021 compared to Q1 2020. Lending was down 26 percent for CMBS, 49 percent for banks, 15 percent for life insurers and 9 percent for the GSEs.
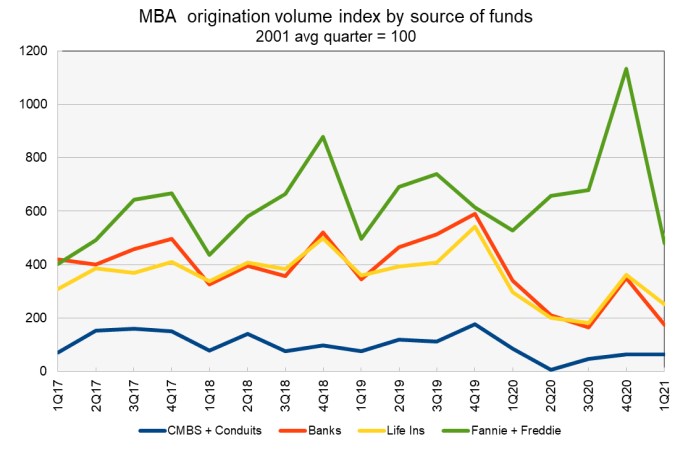
Compared to Q4 2020, lending in Q1 2021 was unchanged for CMBS, down 50 percent for banks, down 31 percent for life insurers and down 58 percent for the GSEs.
The full report from the MBA includes additional information on lending for other commercial property types. It can be found here.


