

Recent reports from CoStar and from Real Capital Analytics (RCA) show that multifamily property prices rose in the year to March.
Defining the indices
The CoStar report focuses on a relative measure of property prices called the CoStar Commercial Repeat Sales Index (CCRSI). Real Capital Analytics calls their equivalent measure the Commercial Property Price Index (CPPI). Both indices are computed based on the resale of properties whose earlier sales prices and sales dates are known. The indices represent the relative change in the prices of property over time rather than its absolute price.
Prices hold up
RCA reported that multifamily property prices in March were up 0.7 percent for the month and were 7.1 percent higher than their levels one year ago. This compares to a 7.8 percent annual increase for all commercial property types. Industrial properties saw the greatest price appreciation over the past 12 months, with an 9.1 percent rise. Office buildings within central business districts were the worst performing sector with a price decline of 2.4 percent for the year.
CoStar reported that its equal-weighted index of multifamily property prices increased 10.2 percent year-over-year in Q1 2021. It was the best performer of the commercial property types CoStar tracks. However, CoStar observed that their Prime Multifamily Metros index fell in Q1, indicating that downtown properties remain out of favor with investors.
Comparing the indices
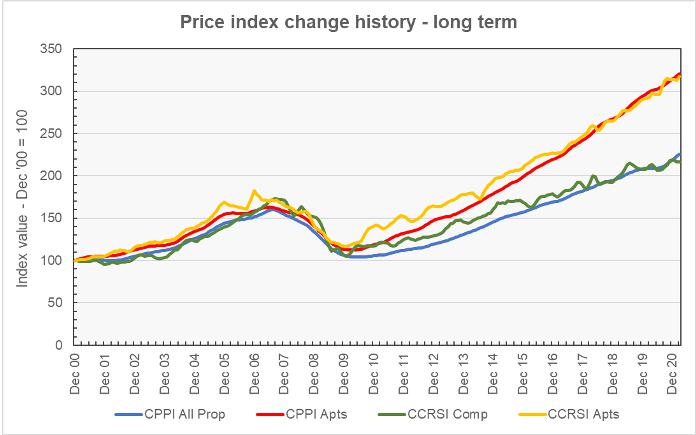
The first chart, below, plots the long-term changes in both the CoStar CCRSI and in the RCA CPPI for multifamily properties. In both cases, the values of the indices are normalized so that the December 2000 index reading is 100. The chart shows that the price histories defined by the two curves are very similar. CoStar index history shows more seasonality, possibly because RCA does more post processing of its data to remove seasonal effects.
The second chart, below, uses the same data but displays it over the last three years. It also re-normalizes the data so that the values of the indices in January 2018 is 100. This removes some of the divergence between the curves and allows them to be plotted on an expanded scale so that smaller differences can be observed.
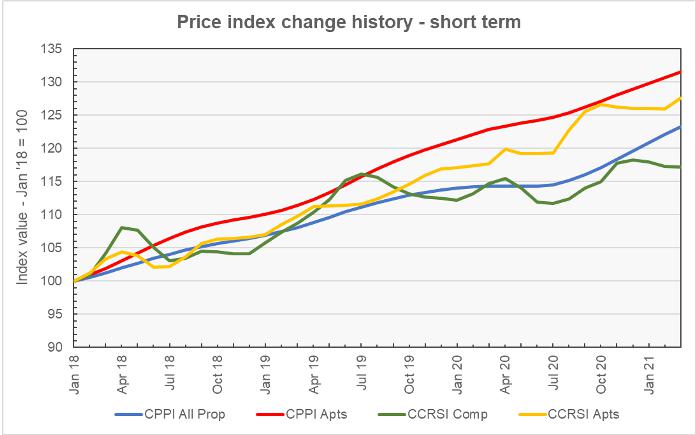
As before, both data sets show similar trends, but the CoStar data set shows more seasonal variation. Both data sets show the price appreciation of multifamily properties being relatively unaffected by the pandemic compared to that of other commercial property. However, lately, the price trends for all commercial properties have diverged, with the RCA data indicating continued price appreciation while the CoStar data shows price appreciation stalling.
One possible explanation is that the CoStar data set includes data on hospitality properties, hotels etc., while the RCA data set does not. Another explanation is that it is just due to seasonal adjustment effects. A similar trend can be observed in the apartment data between October 2020 and February 2021, where the CoStar price index stalled while the RCA index continued to rise. However, the latest CoStar data has apartment prices heading up in line with the RCA data. The same thing may happen for the composite data in the months ahead.
Looking at regional differences
CoStar includes regional property price change data in their report on a quarterly basis. The regional data for multifamily properties is shown in the next chart, below. While the Northeast has been the best performing region over the long-term, recently the West and South regions have been closing the gap.
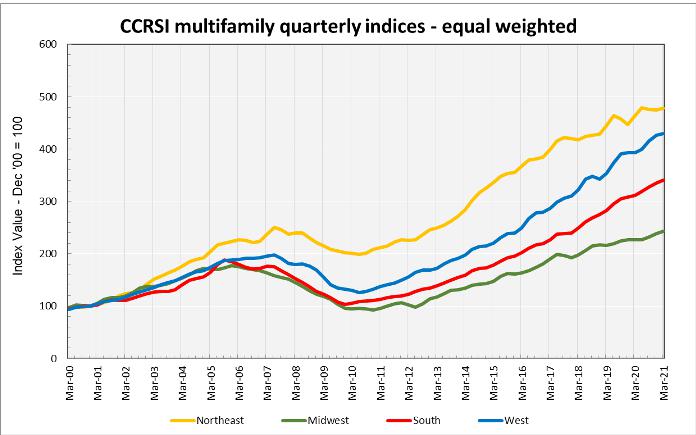
By the numbers, the one-year index increase was 9.4 percent for the South, 9.2 percent for the West and 7.1 percent for the Midwest. The one-year index increase for the Northeast was 3.0 percent. The five-year index increase was 72 percent for the West, 69 percent for the South, 49 percent for the Midwest and 30 percent for the Northeast.
Transactions still subdued
CoStar reported that repeat-sale transaction volume was 20 percent lower in Q1 2021 than in Q1 2020 at $25.4 billion. However, they noted that sales volumes have rebounded significantly from the lows they hit during the onset of the pandemic. The report also noted that “distressed” transaction volume remains at a low level of only 1.9 percent. Distressed transactions’ share of all transactions has not risen appreciably in the last year despite the pandemic.
Better but not well
The RCA report contained a section where it looked back on the strength of the commercial property market before the pandemic. It examined the share of the local markets that were experiencing price increases and pointed out that the share had been declining since 2017. After seeing apartment property prices rise in 92 percent of local markets between 2011 and 2017, only 79 percent of local market saw prices appreciate in 2018 and 2019. In the pandemic year of 2020, this figure dropped to 59 percent.
A graphic in the report shows that prices for multifamily properties rose in 22 of the 33 local markets listed in the year to March. Phoenix saw the most rapid multifamily property price appreciation while San Francisco saw the steepest price decline.
Rising land
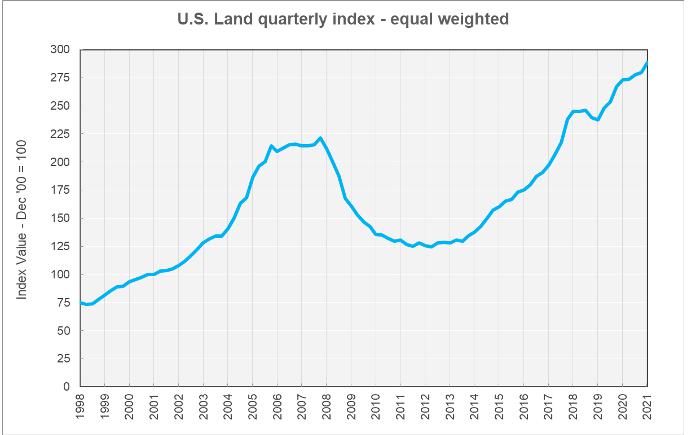
The CoStar report also includes information on land prices. This is shown in the final chart, below. After outpacing all commercial property type in the run-up to the housing bubble bursting in 2008, land prices were hit hard during the subsequent downturn. With December 2000 as the reference point, land value increases have now been outpaced by those of multifamily properties. However, land values have continued to outpace those of other commercial property types.
The full reports discuss all commercial property types. The CoStar report also provides information on transaction volumes, but it does not break out multifamily transactions. The CoStar report can be found here. Access to the RCA report can be obtained here.


