

The week 29 release of the Census Bureau’s Pulse Survey shows that the portion of renters who are current on their rent payments is up since we last reported on the survey results.
What is the Pulse Survey?
The Pulse Survey is an experimental program that the Census Bureau has been running to assess how the population of the country is reacting to the fallout from COVID-19. The current survey, designated Week 29, collected data from April 28 through May 10.
This survey asks a variety of questions about how the respondent is coping financially including questions about paying for housing. A difficulty in using the survey is that the results are presented based on the number of adults (18+) responding in a certain way, not on the number of households. Different households could have different numbers of adult members. When looking at housing, a view from the perspective of households might have made more sense.
One of the questions that the Pulse Survey asks of renters is whether they are current on their rent. While some say that they occupy their housing without paying rent and some did not report whether they are current on their payments, the majority of respondents answered the question Yes or No. The portion of respondents who pay rent saying that they are not current has varied from survey to survey.
The week 13 Pulse Survey taken in the last week of August – 15.3 percent were not current.
The week 16 Pulse Survey taken in early October – 16.2 percent were not current.
The week 21 Pulse Survey taken in mid-December – 19.2 percent were not current.
The week 22 Pulse Survey taken in early to mid-January – 20.8 percent were not current.
The week 25 Pulse Survey taken in late February – 18.5 percent were not current.
The week 29 Pulse Survey taken in early May – 15.0 percent were not current.
For reference, the NMHC rent tracker showed that 5.0 percent of renters at 11.7 million professionally managed apartments had made at least a partial rent payment for April by the end of the month but 20 percent had made no payment for May by May 6. Note that, making a partial payment does not mean that the renter is current. Also, the units covered by the rent tracker represent only about 29 percent of the approximately 40 million occupied rental housing units in the United States. Many of the rental units not covered by the rent tracker are multifamily properties owned by smaller operators, and many more are single family rentals.
Shifting sources of funds
The results show that portion of respondents saying they were not current was lower in the August time frame when supplemental unemployment benefits were available and stimulus money was circulating. After these programs ran out in September and restrictions on the economy were tightened in response to a fall surge in COVID cases, the portion of respondents reporting that they were not current rose. As the economy reopened and as additional support was provided, the portion of respondents saying that they were not current on their rent dropped.
A series of questions in the survey had to do with the sources of funds that the respondent relied on in order to meet their spending needs over the 7 prior days. The question does not quantify to what extent the respondent relied on a particular source, only that they used it to some degree. The first chart, below, compares these sources for week 22, when the share of renters who were behind was highest, to those for week 29, when the share of renters who were behind was lowest.
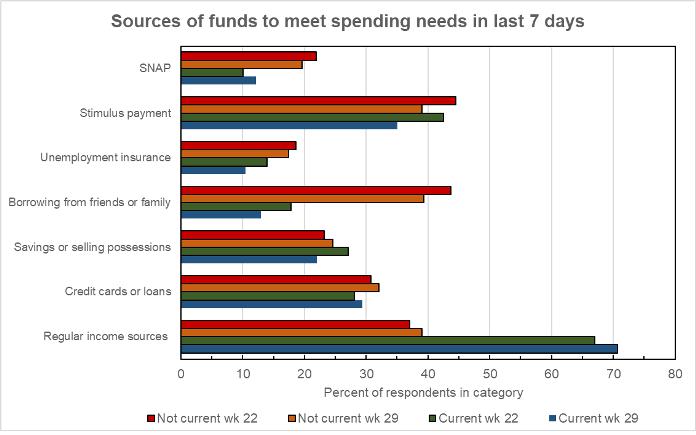
The chart shows that the portions of both renters who were current and those who were not who relied on regular sources of income – read employment income – were higher in week 29 than in week 22. The portions of both groups relying on either stimulus payments or unemployment insurance were down despite new assistance programs in both of these areas having been implemented between the two surveys. In addition, somewhat fewer respondents in both categories relied on borrowing from friends and family in week 29 than did in week 22. Changes in the usage of credit cards, savings and SNAP (food stamps) were mixed with no clear trend emerging.
Profiling the participants
The Pulse Survey asked a series of questions to determine the characteristics of the different households responding to the survey. One question was how many people are in the household. The responses are shown in the first chart, below. The bars show the percentage of respondents within a particular category (current or not current on rent) who responded a certain way.
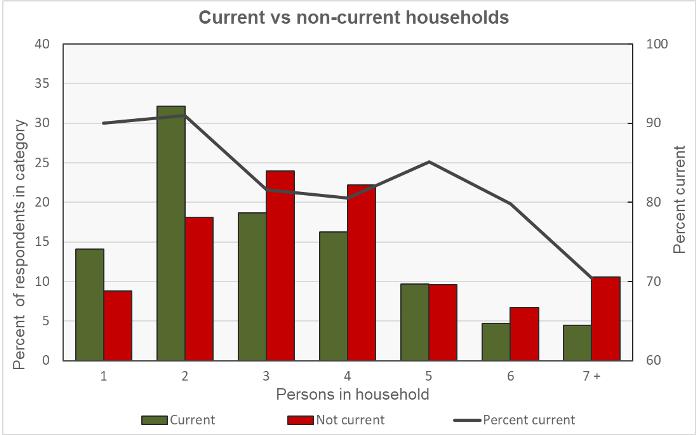
This chart is a little busy so here is an example of how to read the data for a two-person household: the bars on the chart show that about 32 percent of adults who were current on their rent resided in two-person households. About 18 percent of adults who were not current on their rent resided in two-person households. In either case, the two-person household could consist of one adult and one child or it could consist of two adults; the survey does not differentiate between them. The right-hand scale and the black line indicate that about 91 percent of adults residing in two-person households were current on their rent.
The chart shows that households with more people are generally more likely to be behind on their rent. The five-person household is an exception to this rule. This may be due to this category having more working adults in the household relative to the number of children, but the data is not available on this point.
Of the respondents who reported being current on the rent, 36 percent said that they had children in the household. Of those reporting being behind on the rent, 50 percent reported having children in the household.
Of the respondents who reported being current on the rent, 63 percent said that they were employed, but 22 percent reported that a household member had experienced a loss of employment income. Of those reporting being behind on the rent, 46 percent said that they were employed, while 48 percent reported that a household member had experienced a loss of employment income.
The final chart shows the current/not current status of the respondents by household income level. As in the first chart, the bars show the percentage of adults within a particular category (current or not current on the rent) who reported having a certain household income level. Not surprisingly, a much higher percentage of adult respondents who were behind on their rent reported having lower incomes.
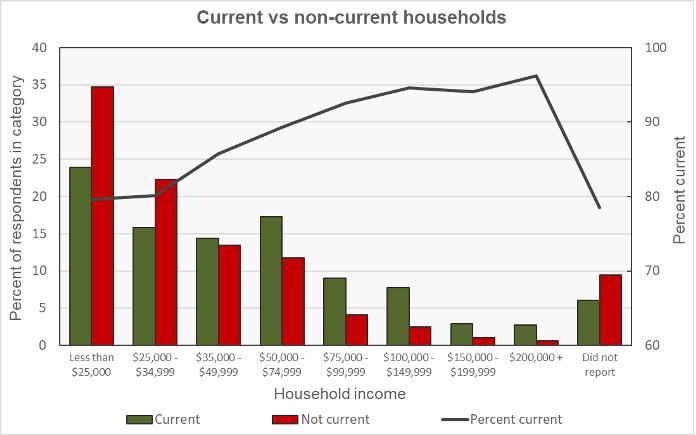
An example of reading this chart for the “Less than $25,000” category is that about 24 percent of responding adults who were current on their rent reported living in households with incomes of less than $25,000. Nearly 35 percent of adults who were behind on their rent reported living in households whose income was less than $25,000. The black line is read on the right-hand scale. It indicates that about 80 percent of adults living in households earning less than $25,000 reported that they were current on their rent.


