

A recent report from CoStar indicates that the remarkably steady rise in multifamily property prices that has taken place over the last two years continued in May.
CCRSI defined
The CoStar report focuses on a relative measure of property prices called the CoStar Commercial Repeat Sales Index (CCRSI). The index is computed based on the resale of properties whose earlier sales prices and sales dates are known. The index represents the relative change in the price of property over time rather than its absolute price.
CoStar identified 1,468 repeat sale pairs in May for all property types. These sales pairs were used to calculate the results quoted here.
Prices rise
CoStar reported that its value-weighted index of multifamily property prices increased 10.2 percent, year-over-year, in May 2021. The index was up 1.2 percent month-over-month.
The value-weighted index of non-multifamily commercial property rose by 4.5 percent, year-over-year, in May. The index fell 1.4 percent month-over-month. The other commercial property types which are tracked by CoStar are office, retail, industrial and hospitality.
Comparing property types
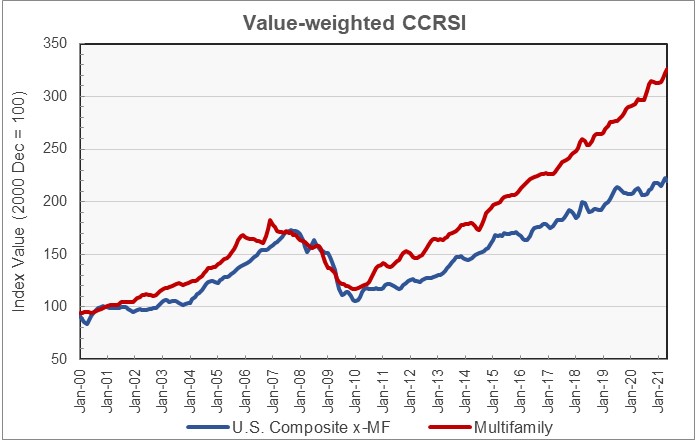
The first chart, below, plots the long-term changes in the CoStar value-weighted CCRSI for both multifamily property and for all other commercial property types considered as a group. The chart shows that multifamily property prices have outpaced those of other commercial property types. It also shows that neither value-weighted index was severely impacted during the worst of the pandemic last year.
The second chart, below, shows the year-over-year change in the value-weighted multifamily property price index and that for all other commercial property types since January 2012. The chart also shows the average growth rates for the two indices over this time span. Looking at the data on a year-over-year basis smooths out the high degree of variation in the monthly data, allowing underlying trends to be seen.
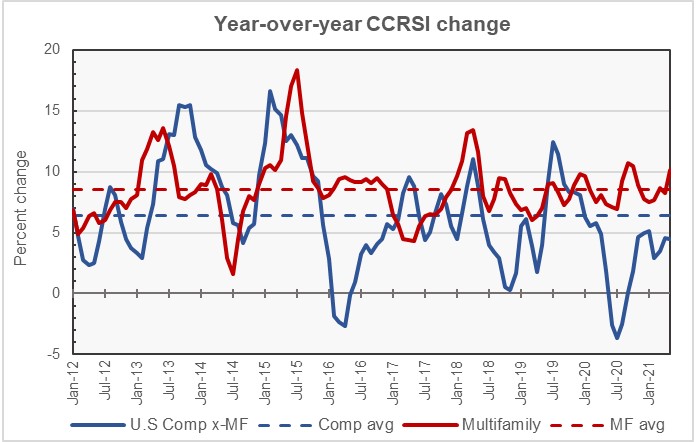
The average annual rate of increase in multifamily property prices since January 2012 has been 8.6 percent, based on the value-weighted CCRSI. The average annual increase in all other commercial property types taken together has been 6.4 percent. That large of a difference in the rates of price appreciation for the two categories of commercial property can make a huge difference in total price growth of the two property types if they are held for any length of time.
The chart also illustrates that the rate of price appreciation for multifamily property has been significantly more stable than has that of other commercial property types. For the mathematicians out there, the standard deviation in the annual price appreciation for other commercial property types was nearly 70 percent greater than than that of the annual price appreciation in multifamily properties over the January 2012 to May 2021 time frame.
The recent stability in the rate of multifamily property price growth has been remarkable given everything that was happening in the economy. Multifamily property prices did not experience the share decline that took place in other commercial property prices last spring as lockdowns were imposed on the economy.
Transactions are rising
CoStar reported that number of repeat-sale transactions was 15 percent higher in the first five months of 2021 than in the first five months of 2019, before anyone had heard of COVID-19. This is a good a sign, indicating that market conditions are returning to normal.
The full reports discuss all commercial property types, but detailed data on each of the property types and regional data is only reported quarterly. The CoStar report provides information on transaction volumes, but it does not break out multifamily transactions. The latest CoStar report can be found here.


