

The Census Bureau released its monthly new residential construction report for May 2021. It stated that some results were down from those in recent reports, but they were still strong compared to historical levels.
Multifamily housing construction permits remain at high level
The number of permits issued for buildings with 5 or more units fell in May to 494,000 units on a seasonally adjusted, annualized basis. This was down 7.7 percent from April’s figure despite that figure being adjusted downward by 24,000 units. May permits were up 10 percent from the level of May 2020 and were also up 9.5 percent compared to the trailing 12-month average.
In addition, 57,000 permits were issued in May for units in buildings with 2 to 4 units. This was up 14 percent from the revised level of the previous month, aided by the fact that the April level was adjusted downward by 2,000 units. May permits for units in buildings with 2 to 4 units were up 30 percent from the pandemic-impacted year-ago level and up 16 percent compared to the trailing 12-month average.
Regional data for multifamily housing is only reported for structures with two or more units. “Structures with 5 or more units” is not broken out as a separate category. Since the regional data is highly volatile and is frequently revised, it is examined here based on three-month moving averages. This averaging will tend to smooth out the variations in the data.
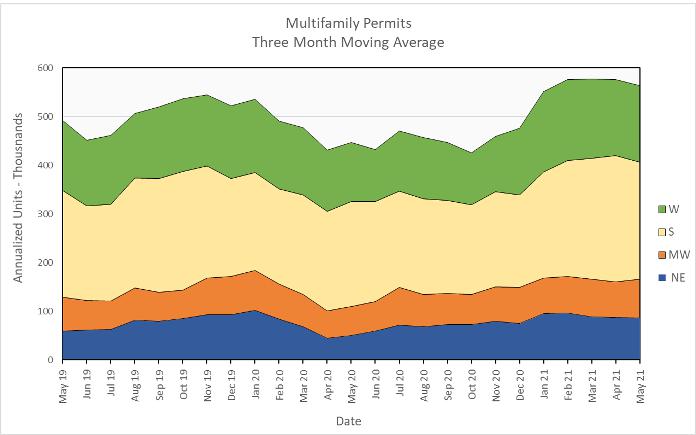
Nationally, the three-month weighted moving average for permits issued for multifamily housing in May was down 2 percent from the very strong level of April, but was 26 percent higher than the level of May 2020. Permit issuance history is shown in the first chart, below. The three-month weighted moving average for permits came it at 564,000 units.
On a month over month basis, the three-month weighted moving average for permit issuance was up 8 percent in the Midwest and 1 percent in the West. It fell 1 percent in the Northeast and 7 percent in the South.
When compared to year-earlier levels, the three-month weighted moving average of permits issued was up 72 percent in the Northeast, 34 in the Midwest, 30 percent in the West and 11 percent in the South.
The following chart shows the three-month weighted moving averages of permits by region for the last 25 months.
Multifamily housing construction starts rise, sort of
The preliminary May figure for multifamily housing starts in buildings with 5 or more units was 465,000 units on a seasonally adjusted, annualized basis. This was reported to be up 4 percent from the revised April figure but only because that figure was revised downward by 23,000 units (4.9 percent). This report is the second consecutive one where starts were reported higher only because the previous month’s starts figure was adjusted sharply downward.
The preliminary starts figure for May is a relatively high one. It is 22 percent higher than the trailing 12-month average and it is 19 percent higher than the average monthly level from 2019. It is 52 percent higher than the level in May 2020.
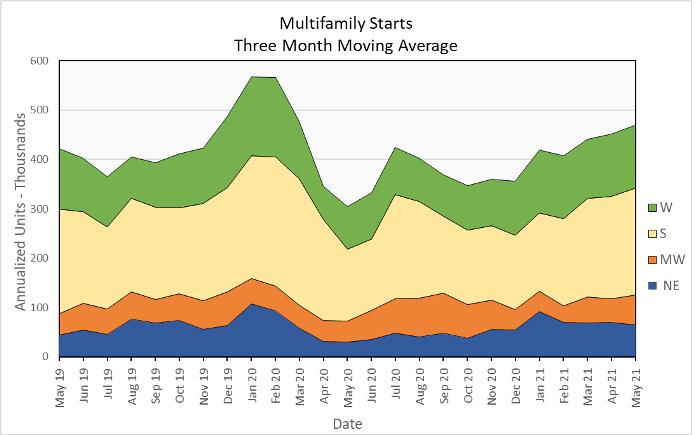
Multifamily housing construction starts (two or more units per building) in May were up 4 percent from their April level for the country as-a-whole, based on three-month weighted moving averages. Starts were up 25 percent in the Midwest, 4 percent in the South and 1 percent in the West. Starts fell 6 percent in the Northeast from the previous month.
The three-month weighted moving average of starts was up 54 percent for the country-as-a-whole on a year-over-year basis. Compared to May 2020, starts were up 116 percent in the Northeast, 49 percent in the South, 47 percent in the West and 44 percent in the Midwest.
The following chart shows the starts by region for the last 25 months.
Multifamily housing completions decline, but are still at a high level
The preliminary May multifamily housing unit completions figure in buildings with 5 or more units per building was 387,000 units on a seasonally adjusted, annualized basis. This was down 7.6 percent from April’s revised figure. However, April’s completions figure was revised upward by 4.5 percent from the preliminary value reported last month, making the completions figure comparison seem worse.
Compared to May 2020, multifamily housing completions in buildings with 5 or more units per building were up 18 percent. Compared to the trailing 12-month average, completions were also up, rising 3 percent. Completions were up 12 percent from the average monthly level in 2019 and up 7 percent from the average monthly level in 2020.
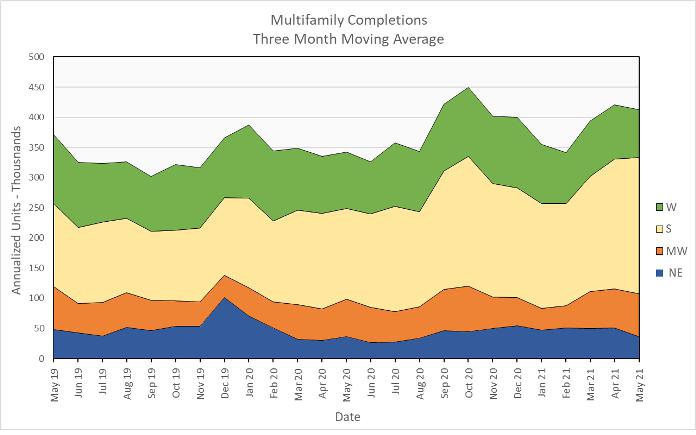
For the country as-a-whole, multifamily housing construction completions (two or more units per building) were down 2 percent month-over-month, comparing three-month weighted moving averages. The three-month weighted moving averages of completions were up 9 percent in the Midwest and 5 percent in the South. Completions fell 12 percent in the West and 28 percent in the Northeast. Completion in the South represent more than half of all completions nation-wide.
On a year-over-year basis, the three-month weighted moving average of completions in buildings with 2 or more units per building was up 21 percent nationally. Completions were up 50 percent in the South, 14 percent in the Midwest and 1 percent in the Northeast. Completions fell 15 percent in the West.
Completions by region for the past 25 months are shown in the chart below.
All data quoted are based on seasonally adjusted results and are subject to revision.
Starting in February 2021, the calculation of the moving average was changed to put more weight on the current month and progressively less weight on the two prior months. Previously, all three months were weighted equally in calculating the moving average.


