

The Census Bureau’s report on construction spending shows that the value of residential construction put in place in May was up 0.2 percent from the revised level for April. Overall construction spending was up 0.3 percent for the month and was 7.5 percent higher than its level in May 2020.
Fall in improvements offsets rise in single-family
The preliminary report on total private residential construction put in place in May came in at $752 billion on a seasonally adjusted, annualized basis. This figure, which includes spending on both new construction and on improvements, was up 29 percent year-over-year.
The value of new construction of multifamily residential buildings put in place in April was reported to be $99.3 billion on a seasonally adjusted, annualized basis. This was essentially unchanged from the revised level for April. The value of multifamily housing construction put in place in May was 26 percent higher than the level of May 2020.
The value of new single-family residential construction put in place in May was $402.3 billion on a seasonally adjusted, annualized basis. This was up 0.8 percent from the revised level for April and was up 46 percent from the level of May 2020.
The value of improvements to residential buildings put in place in May was reported to be $250.2 billion on a seasonally adjusted, annualized basis. This was down 0.7 percent from the revised level for April but was up 18.3 percent from the year-earlier level. The Census Bureau does not indicate whether improvements were for single-family or multifamily residential buildings.
Charting the data
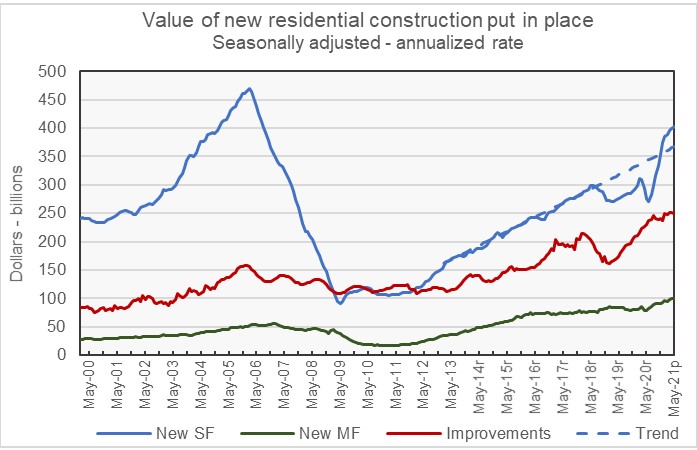
The first chart, below, shows the history of new residential construction spending since January 2000 for single-family housing, multifamily housing and residential improvements. It also shows a trendline for single-family construction based on the steady growth in the value of construction put in place between 2013 and 2018. The chart shows that single-family residential construction slowed in early 2018 and then dropped again when the COVID related shutdowns were imposed in 2020. The recent rebound in single-family construction has put the rate of new single-family construction put in place above the trendline.
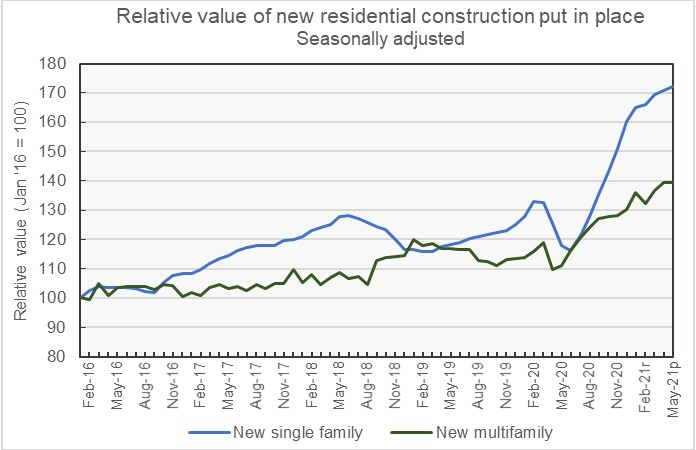
The final chart focuses on the time period since January 2017. In this chart, the value of the construction put in place for the two categories of residential construction are normalized so that the readings for January 2017 equal 100. This chart shows that multifamily housing construction was less affected by the shutdowns imposed last spring than was single-family construction. However, multifamily’s rebound as the economy reopened was also less sharp. The other trend to notice is that the growth in the value of construction put in place for both property types has plateaued. The sharp rate of growth since last June was unsustainable and has now moderated.
The report from the Census Bureau also includes information on spending on other types of construction projects. The full report can be found here


