

CoStar recently released its quarterly report on the change in values of commercial property in the United States. It reported that multifamily property values rose nearly 12 percent over the last 12 months, leading all commercial property types except land.
Defining the index
The CoStar report focuses on a relative measure of property values called the CoStar Commercial Repeat Sales Index (CCRSI). This index is computed based on the resale of properties whose earlier sales prices and sales dates are known. The index represents the relative change in the price of property over time rather than its absolute worth.
By focusing on repeat sales rather than all sales, the index compensates for the effects of potentially comparing the sales of properties with different characteristics in different time periods. However, by only using repeat sales, the number of transactions that can be used to calculate the index in any time period is reduced. In June 2020, there were 1,788 sales pairs for all of the property types tracked by CoStar. By comparison, there were 888 sales pairs in June 2020 and 1,453 sales pairs in June 2019. CoStar does not break out the number of transactions by property type so we do not know how many of those transactions were for multifamily properties.
Comparing commercial property types
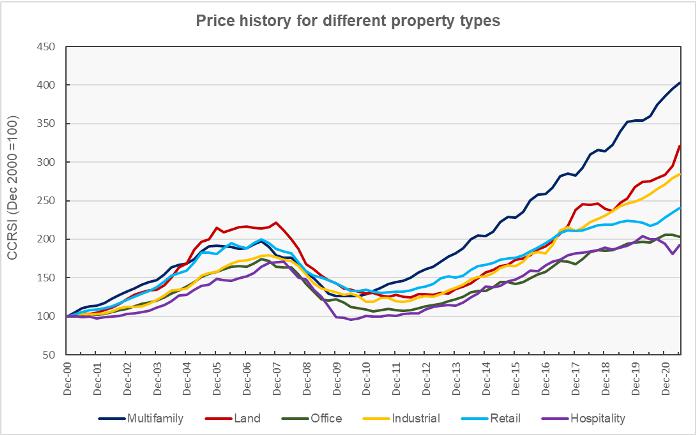
The first chart shows how multifamily property values have changed over time relative to the values of other primary commercial property types CoStar tracks. The data is normalized so that the index values for all property types are set to be 100 in December 2000. The change in the value of the index since then shows how the relative value of that property type has changed. The chart shows that multifamily property values have risen faster than those of office, industrial or retail property, particularly since the recovery from the recent downturn began around 2010.
The second chart plots the same data but renormalizes it so that the CCRSI value in December 2014 is set to 100 for each of the property types. It also expands the time scale so that recent trends in the indexes are more visible. It shows that multifamily, industrial and land values have risen at similar rates over the past 7 years and that they have outpaced the rise in the values of office, retail and hospitality properties over that time.
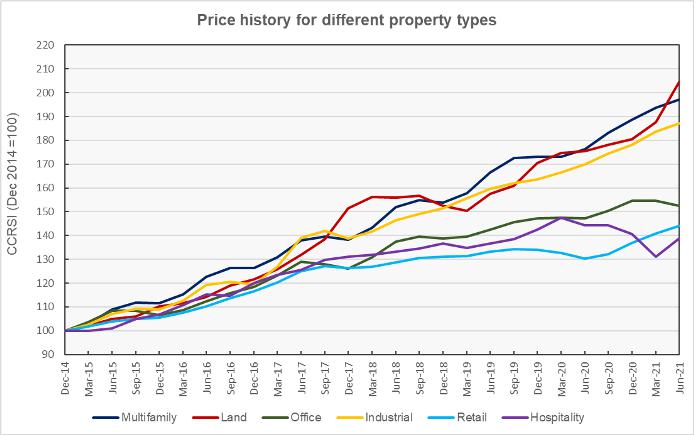
The best performing property type over the past 12 months has been land, whose price index has risen 16.5 percent. This is followed by multifamily, whose index has risen by 11.9 percent, retail, whose index rose 10.6 percent, and industrial, whose index rose 10.0 percent. On a year-over year basis, hospitality trailed all commercial property types with a price decline of 3.8 percent.
Compared to the previous quarter, land prices were up 8.9 percent in Q2 2021. Hospitality prices were up 6 percent while multifamily property prices were up 1.8 percent.
Comparing regions
The next chart shows how the CoStar multifamily price indexes for the four Census regions of the United States have changed since 2000. As before, each of the indexes is normalized to a value of 100 in December 2000, and the chart shows the relative change in value since then. Having a higher index value for a give region does not necessarily mean that the value of the property in dollars per door or dollars per square foot is higher than in the other regions since the property prices were different by region in December 2000 and the indexes are computed relative to these prices.
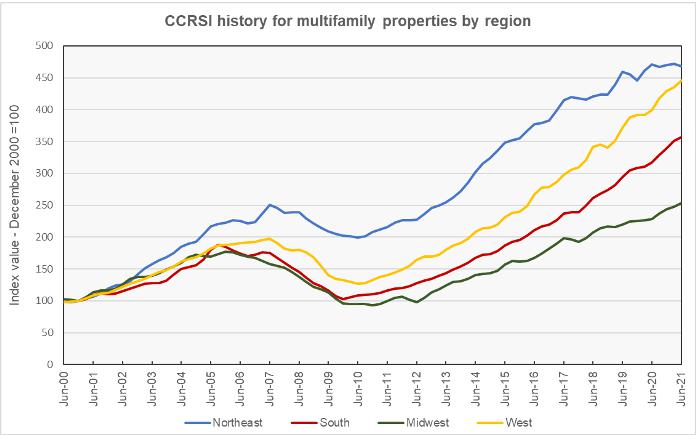
The chart shows that the Northeast has been the region with the highest appreciation in multifamily property values since December 2000, with prices rising by 358 percent since then. The West was next in line with a rise of 345 percent followed by the South with a rise of 257 percent. The Midwest has had the lowest property value appreciation with prices rising by only 154 percent. For reference, inflation as measured by the consumer price index (CPI) is up 56 percent over that time.
Using CoStar’s equal weighted indexes and comparing to year-earlier levels, prices were up by 12.6 percent in the South, 11.5 percent in the West and 11.0 percent in the Midwest. Prices fell by 0.5 percent in the Northeast.
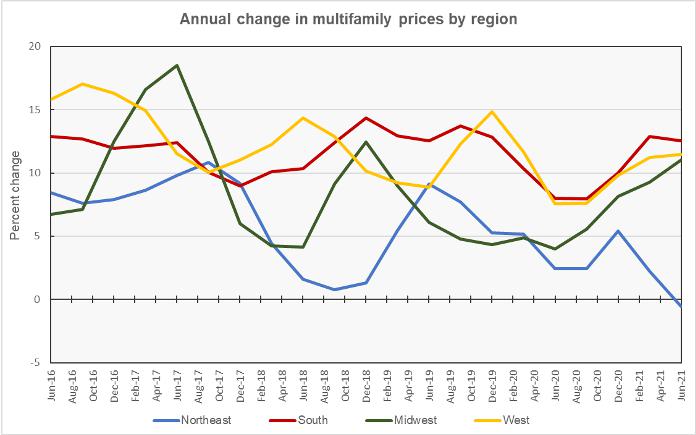
The next chart shows the year-over-year change in the regional multifamily property price indexes for the last 5 years. Two conclusions that can be drawn from this chart. The first is that the annualized rates of price appreciation for multifamily properties in the South and West regions have consistently outpaced those in the Midwest and the Northeast over the time period represented by the chart. The second is that property prices for all of the regions except for the Northeast have bounced back from the dip they took in the summer of 2020 when the COVID shutdowns were at their worst.
The full report has additional information about transaction volumes, including “distressed” transactions. However, this data is not broken out by property type. The full report can be found here.


