

The Census Bureau released its monthly new residential construction report for July 2021. It reported good results for permits, starts and completions compared to long-term averages, if not when compared to recent highs.
Multifamily housing permits rise
The number of permits issued for buildings with 5 or more units in July was reported to be 532,000 units on a seasonally adjusted, annualized basis. This was up 11 percent (49,000 units) from the revised figure for June. However, the June figure was revised down by 2,000 units, contributing to the reported gain. July permits were up 6 percent from the level of July 2020 and were also up 14 percent compared to the trailing 12-month average.
In addition, 55,000 permits were issued in July for units in buildings with 2 to 4 units. This was up 12 percent (6,000 units) from the revised level for June, which was adjusted downward by 3,000 units. July permits for units in buildings with 2 to 4 units were up 12 percent from the year-ago level and up 7 percent compared to the trailing 12-month average.
Regional data for multifamily housing is only reported for structures with two or more units. “Structures with 5 or more units” is not broken out as a separate category. Since the regional data is highly volatile and is frequently revised, it is examined here based on three-month moving averages. This averaging will tend to smooth out the month-to-month variations in the data.
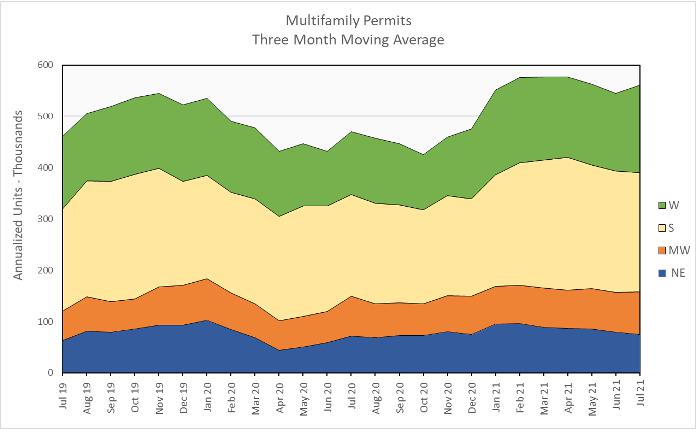
Nationally, the three-month weighted moving average for permits issued for multifamily housing in July was up 3 percent from the level in June and was 19 percent higher than the level of July 2020. Permit issuance history is shown in the first chart, below. The three-month weighted moving average for permits came it at 561,000 units.
On a month over month basis, the three-month weighted moving average for permit issuance was up 13 percent in the West and 7 percent in the Midwest. It fell 2 percent in the South and 6 percent in the Northeast.
When compared to year-earlier levels, the three-month weighted moving average of permits issued was up 38 percent in the West, 17 percent in the South, 9 percent in the Midwest and 4 percent in the Northeast.
The following chart shows the three-month weighted moving averages of permits by region for the last 25 months.
Multifamily housing construction starts drop
The preliminary July figure for multifamily housing starts in buildings with 5 or more units was 412,000 units on a seasonally adjusted, annualized basis. This was reported to be down 14 percent (65,000 units) from the revised figure for June. However, in this report, June’s figure was revised upward by 3,000 units and May’s figure was revised upward by 42,000 units, so starts in those months were higher than was earlier believed. Also, the preliminary starts figure reported for July was 2 percent above the trailing 12-month average and 6 percent above the monthly average for 2019, so it was a reasonably good performance.
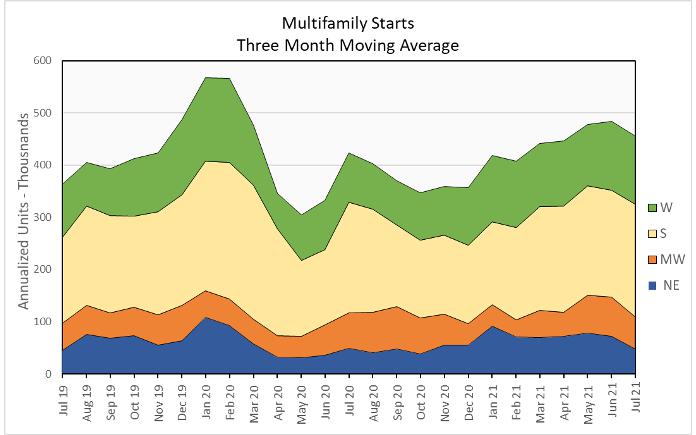
Multifamily housing construction starts (two or more units per building) in July were down 6 percent from their June level for the country as-a-whole, based on three-month weighted moving averages. Starts were up 5 percent in the South but fell 1 percent in the West, 17 percent in the Midwest and 34 percent in the Northeast from the level of the previous month.
The three-month weighted moving average of starts was up 8 percent for the country-as-a-whole on a year-over-year basis. Compared to July 2020, starts were up 38 percent in the West and 2 percent in the South. Starts fell 2 percent in the Northeast and 10 percent in the Midwest.
The following chart shows the starts by region for the last 25 months.
Multifamily housing completions higher
The preliminary July multifamily housing unit completions figure in buildings with 5 or more units per building was 426,000 units on a seasonally adjusted, annualized basis. This was reported to be up 10 percent (37,000 units) from June’s revised figure, but most of the reported gain was due to a sharp downward revision (-27,000 units) in the completions figure for June.
Compared to July 2020, multifamily housing completions in buildings with 5 or more units per building were up 12 percent. Compared to the trailing 12-month average, completions were also up, rising 10 percent. Completions were up 22 percent from the average monthly level in 2019 and up 18 percent from the average monthly level in 2020.
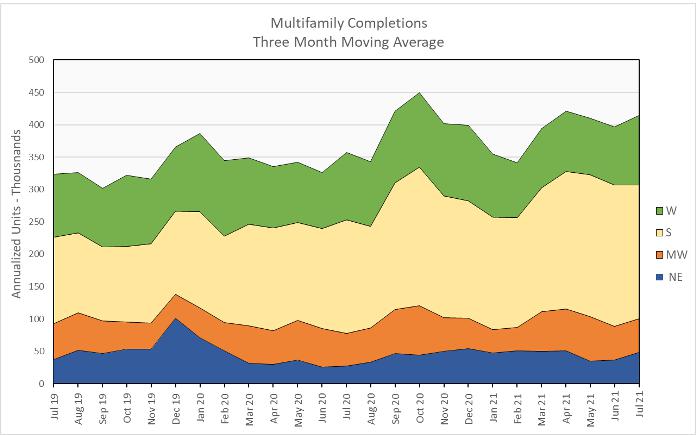
For the country as-a-whole, multifamily housing construction completions (two or more units per building) were up 5 percent month-over-month, comparing three-month weighted moving averages. The three-month weighted moving averages of completions were up 31 percent in the Northeast, 20 percent in the West and 1 percent in the Midwest. Completions fell 6 percent in the South.
On a year-over-year basis, the three-month weighted moving average of completions in buildings with 2 or more units per building was up 16 percent nationally. Completions were up 76 in the Northeast, 18 percent in the South and 3 percent in both the West and Midwest. The large percentage increase in completions in the Northeast is due more to the level of completions being very low a year ago than it is to the level of completions being very high now. Completions in the Northeast in July were only about 11 percent above the trailing 12-month average.
Completions by region for the past 25 months are shown in the chart below.
All data quoted are based on seasonally adjusted results and are subject to revision.
Starting in February 2021, the calculation of the moving average was changed to put more weight on the current month and progressively less weight on the two prior months. Previously, all three months were weighted equally in calculating the moving average.


