

The Census Bureau’s report on construction spending shows that the value of residential construction put in place in June was up 1 percent month-over-month and up 29 percent year-over-year. However, the apparent strength of the year-over-year number is partly due to the relative weakness of construction activity last summer during the COVID lockdowns.
Single-family leads the way
The reported value of total private residential construction put in place in June 2021 came in at $763 billion on a seasonally adjusted, annualized basis. This figure, which includes spending on both new construction and on improvements, was up $8 billion from May’s revised figure.
The value of new construction of multifamily residential buildings put in place in June was reported to be $99.1 billion on a seasonally adjusted, annualized basis. This was down fractionally from the revised level for May. The value of multifamily housing construction put in place in June 2021 was 20 percent higher than the level of June 2020.
The value of new single-family residential construction put in place in June was $411.8 billion on a seasonally adjusted, annualized basis. This was up 1.8 percent from the revised level for May and was up 52 percent from the depressed level of June 2020.
The value of improvements to residential buildings put in place in June was reported to be $252.5 billion on a seasonally adjusted, annualized basis. This was up 0.4 percent from the revised level for May and was up 16.5 percent from the year-earlier level. The Census Bureau does not separate out improvements for single-family and multifamily residential buildings.
Charting the data
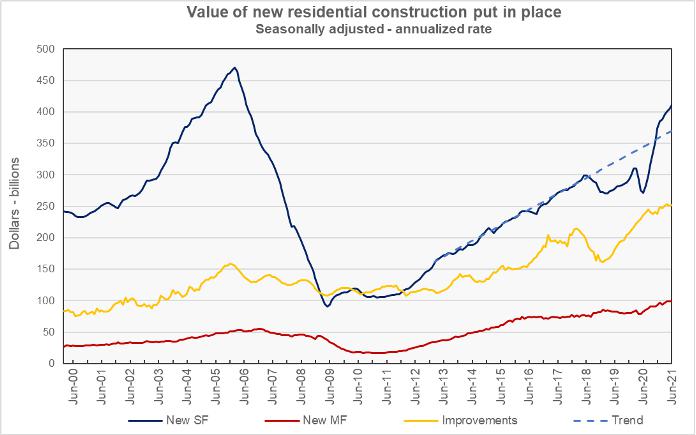
The first chart, below, shows the history of new residential construction spending since January 2000 for single-family housing, multifamily housing and residential improvements. It also shows a trendline for single-family construction based on the steady growth in the value of single-family housing put in place between 2013 and 2018. After a period of below-trend growth, the value of single-family housing put in place has accelerated recently. However, its monthly value is still 12 percent below the level it reached in early 2006. By contrast, the monthly value of multifamily housing put in place is 80 percent higher than the peak value reached in 2006.
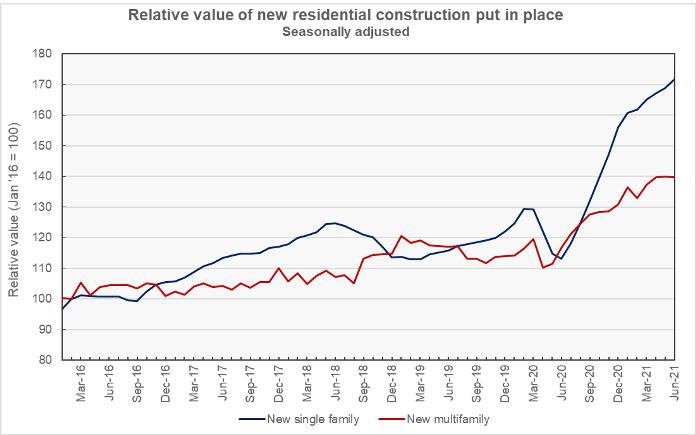
The final chart focuses on the time period since January 2017. In this chart, the value of the construction put in place for the two categories of new residential housing construction are normalized so that the readings for January 2017 equal 100. This chart shows that the growth in the value of single-family housing put in place in recent months remains strong while the value of multifamily housing put in place has been nearly unchanged for the last three months.
The report from the Census Bureau also includes information on spending on other types of construction projects. The full report can be found here


