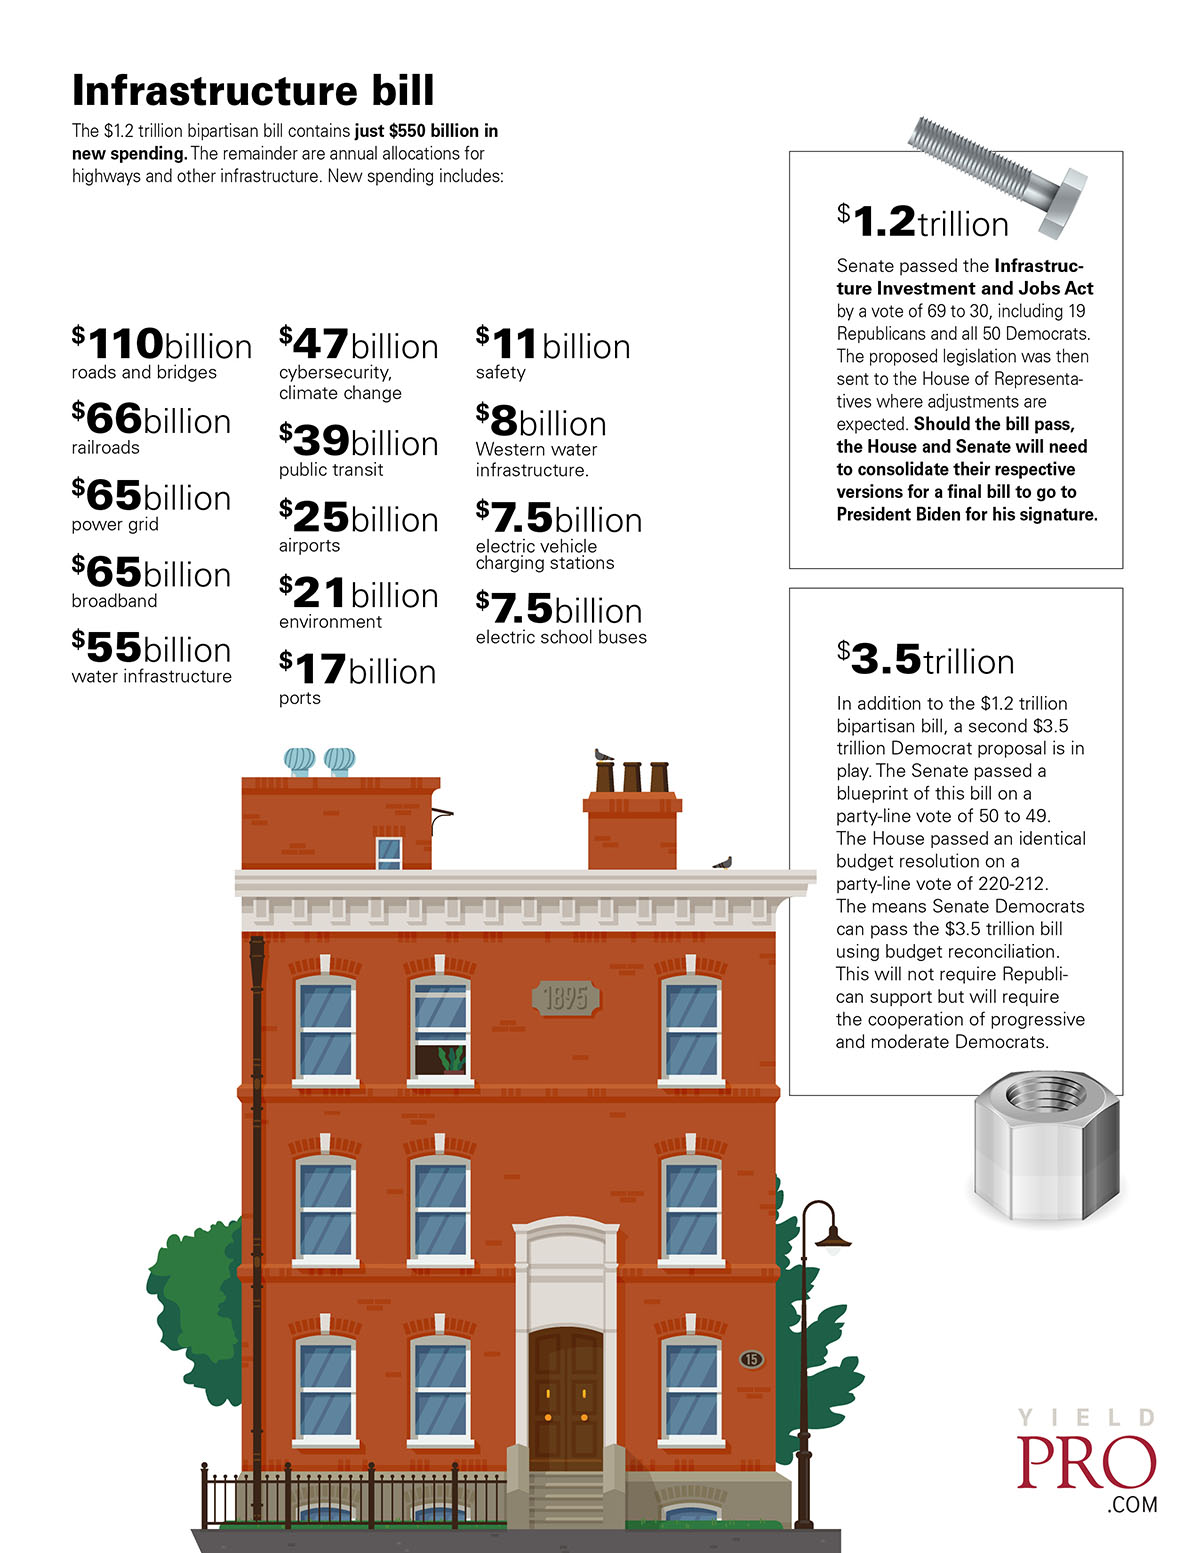
The $1.2 trillion bipartisan bill contains just $550 billion in new spending. The remainder are annual allocations for highways and other infrastructure. New spending includes:
- $110 billion roads and bridges
- $66 billion railroads
- $65 billion power grid
- $65 billion broadband
- $55 billion water infrastructure
- $47 billion cybersecurity, climate change
- $39 billion public transit
- $25 billion airports
- $21 billion environment
- $17 billion ports
- $11 billion safety
- $8 billion Western water infrastructure.
- $7.5 billion electric vehicle charging stations
- $7.5 billion electric school buses
$1.2 trillion
Senate passed the Infrastructure Investment and Jobs Act by a vote of 69 to 30, including 19 Republicans and all 50 Democrats.
The proposed legislation was then sent to the House of Representatives where adjustments are expected. Should the bill pass, the House and Senate will need to consolidate their respective versions for a final bill to go to President Biden for his signature.
$3.5 trillion
In addition to the $1.2 trillion bipartisan bill, a second $3.5 trillion Democrat proposal is in play. The Senate passed a blueprint of this bill on a party-line vote of 50 to 49.
The House passed an identical budget resolution on a party-line vote of 220-212.
The means Senate Democrats can pass the $3.5 trillion bill using budget reconciliation. This will not require Republican support but will require the cooperation of progressive and moderate Democrats.
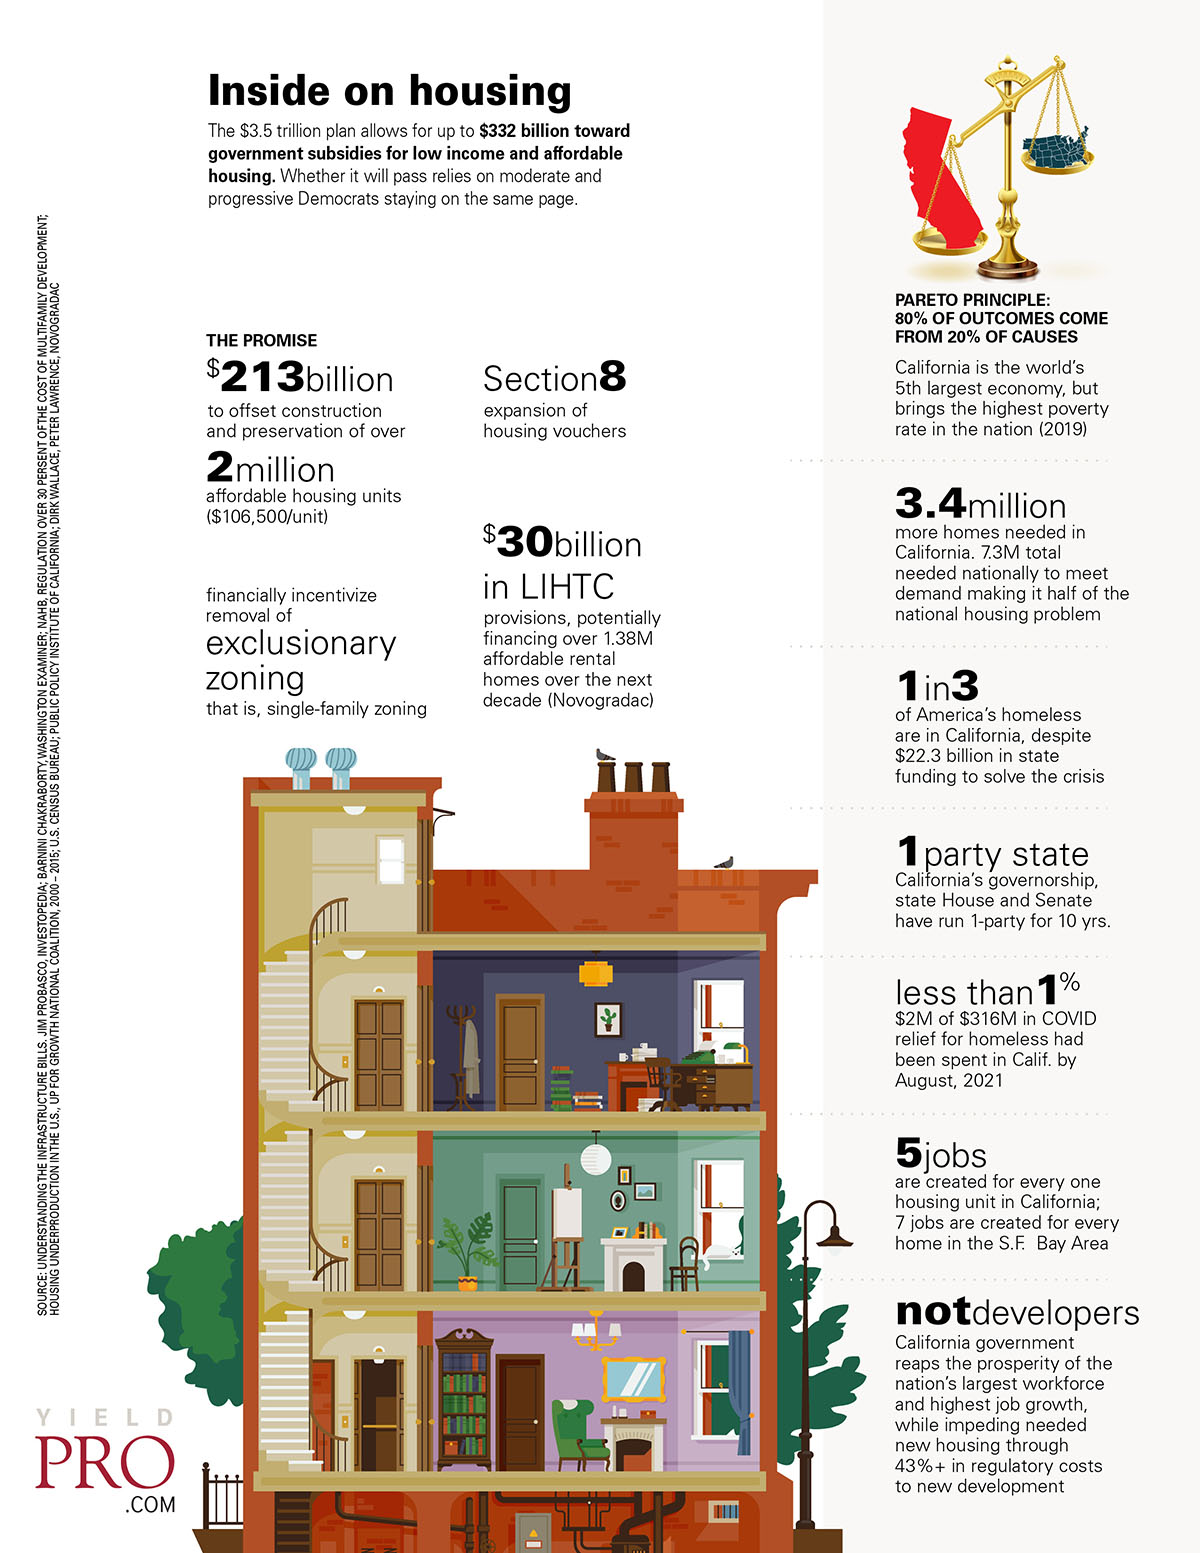
Inside on housing
The $3.5 trillion plan allows for up to $332 billion toward government subsidies for low income and affordable housing. Whether it will pass relies on moderate and progressive Democrats staying on the same page.
The promise
- $213 billion to offset construction and preservation of over
- 2 million affordable housing units ($106,500/unit)
- Section 8 expansion of housing vouchers
- Financially incentivize removal of exclusionary zoning that is, single-family zoning
- $30 billion in LIHTC provisions, potentially financing over 1.38M affordable rental homes over the next decade (Novogradac)
Pareto principle: 80% of outcomes come from 20% of causes
California is the world’s 5th largest economy, but brings the highest poverty rate in the nation (2019)
3.4 million more homes needed in California. 7.3M total needed nationally to meet demand making it half of the national housing problem
1 in 3 of America’s homeless are in California, despite $22.3 billion in state funding to solve the crisis
1-party state. California’s governorship, state House and Senate have run 1-party for 10 yrs.
less than 1%. $2M of $316M in COVID relief for homeless had been spent in Calif. by August, 2021
5 jobs. are created for every one housing unit in California; 7 jobs are created for every home in the S.F. Bay Area
Not developers. California government reaps the prosperity of the nation’s largest workforce and highest job growth, while impeding needed new housing through 43%+ in regulatory costs to new development.