

The Census Bureau’s report on construction spending shows that the value of residential construction put in place in July was up 27 percent year-over-year.
Improvements offset single-family
The reported value of total private residential construction put in place in July 2021 came in at $773 billion on a seasonally adjusted, annualized basis. This figure, which includes spending on both new construction and on improvements, was up $4.1 billion from June’s revised figure. However, the preliminary figure reported for June was revised upward by $5.5 billion, so the preliminary figure for July is actually $9.5 billion higher than the preliminary figure for June reported last month.
The value of new construction of multifamily residential buildings put in place in June was reported to be $98.8 billion on a seasonally adjusted, annualized basis. This was down fractionally from the revised level for June despite that figure being adjusted slightly downward (-$46 million). The value of multifamily housing construction put in place in July 2021 was 15 percent higher than the level of July 2020.
The value of new single-family residential construction put in place in July was $416.3 billion on a seasonally adjusted, annualized basis. This was up 0.9 percent from the revised level for June and was up 47 percent from the pandemic-impacted level of July 2020.
The value of improvements to residential buildings put in place in June was reported to be $257.9 billion on a seasonally adjusted, annualized basis. This was up 0.2 percent from the revised level for June and was up 7.7 percent from the year-earlier level. The Census Bureau does not separate out improvements for single-family and multifamily residential buildings.
Charting the data
The first chart, below, shows the history of new residential construction spending since January 2000 for single-family housing, multifamily housing and residential improvements. It also shows a trendline for single-family construction based on the steady growth in the value of construction put in place between 2013 and 2018.
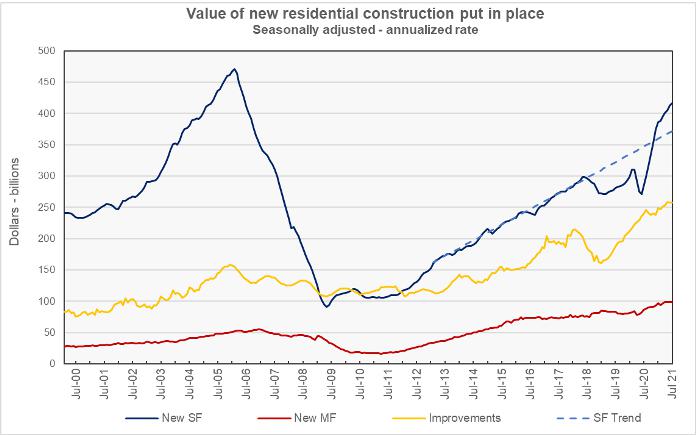
The chart shows rapid run-up and collapse in single family construction during the housing bubble of the 2000’s. It also shows that the value of multifamily housing construction has greatly exceeded the level it reached at the height of the bubble, while single family construction is still working its way back.
The final chart focuses on the period since January 2016. In this chart, the values of the construction put in place for the two categories of residential construction are normalized so that the readings for January 2016 equal 100. This chart is provided so that recent trends are more easily seen. It shows the value of single-family housing put in place is continuing to rise while the value of multifamily housing has been basically flat for four months.
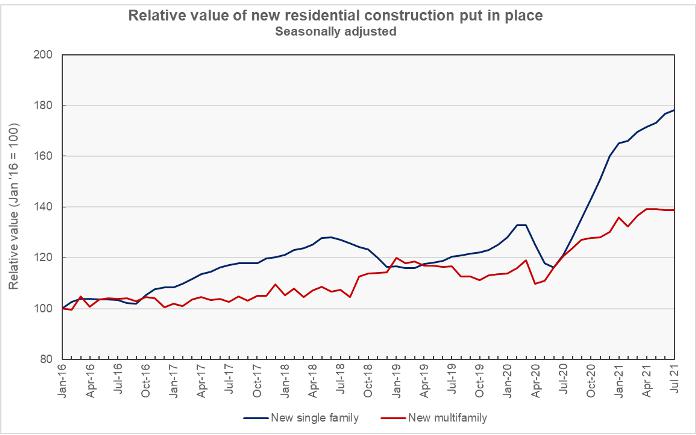
It is interesting to note that the Census report on unit completions also indicates that multifamily completions have been flat recently. However, the completions report also showed a spike in completions around October 2020. That spike does not appear in the construction spending report.
The report from the Census Bureau also includes information on spending on other types of construction projects. The full report can be found here.


