

The Census Bureau’s new residential construction report for October showed an uptick in multifamily housing construction activity from last month’s relatively weak level.
Multifamily housing permits issuance rebounds
The number of permits issued for buildings with 5 or more units in October was reported to be 528,000 units on a seasonally adjusted, annualized basis. This was up 6.5 percent (32,000 units) from the revised figure (-2,000 units) for September. October permits were up 34 percent from the very weak level recorded in October 2020 and were up 5.7 percent compared to the trailing 12-month average.
In addition, 53,000 permits were issued in October for units in buildings with 2 to 4 units. This was up 8 percent (4,000 units) from the revised level for September. October permits for units in buildings with 2 to 4 units were down 12 percent from the year-ago level but up 3 percent compared to the trailing 12-month average.
Regional data for multifamily housing is only reported for structures with two or more units. “Structures with 5 or more units” is not broken out as a separate category. Since the regional data is highly volatile and is frequently revised, it is examined here based on three-month moving averages. This averaging will tend to smooth out the month-to-month variations in the data.
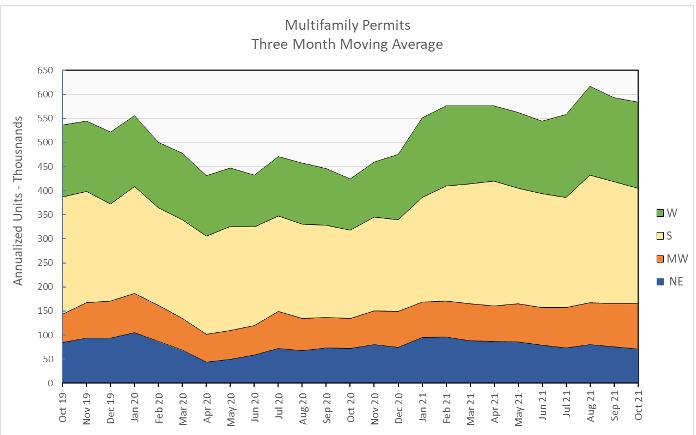
Nationally, the three-month weighted moving average for permits issued for multifamily housing in October was down 2 percent from the level in September but was 37 percent higher than the level of October 2020. Permit issuance history is shown in the first chart, below. The three-month weighted moving average for permits came it at 584,000 units.
On a month over month basis, the three-month weighted moving average for permit issuance was up 7 percent in the Midwest and 2 percent in the West, but was down 6 percent in the South and 7 percent in the Northeast.
When compared to year-earlier levels, the three-month weighted moving average of permits issued was up 67 percent in the West, 54 percent in the Midwest and 30 percent in the South, but was down 3 percent in the Northeast.
The following chart shows the three-month weighted moving averages of permits by region for the last 25 months.
Multifamily housing construction starts edge higher
The preliminary October figure for multifamily housing starts in buildings with 5 or more units was 470,000 units on a seasonally adjusted, annualized basis. This was reported to be up 7 percent (30,000 units) from the revised figure for September. However, September’s figure was revised downward by 27,000 units, so the preliminary starts figure reported for October was nearly unchanged from the preliminary starts figure for September reported last month.
Compared to October 2020, which was a relatively weak period for starts, multifamily housing starts in buildings with 5 or more units was up 40 percent. The preliminary starts figure reported for October 2021 was 11 percent above the trailing 12-month average and 20 percent above the monthly average for 2019.
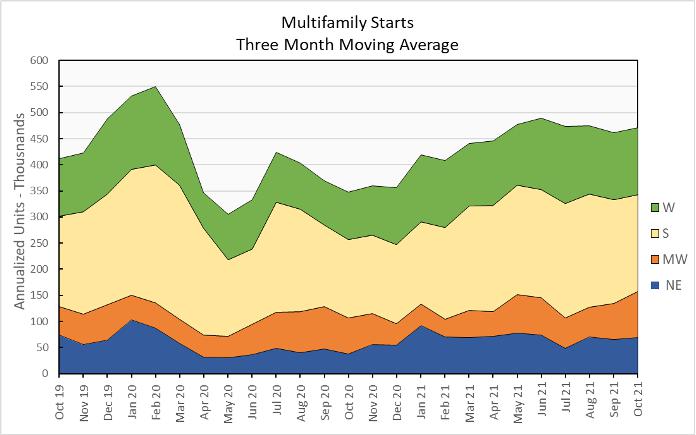
Multifamily housing construction starts (two or more units per building) in October were up 2 percent from their September level for the country as-a-whole, based on three-month weighted moving averages. Starts were up 29 percent in the Midwest and 4 percent in the Northeast but down less than 1 percent in the West and 6 percent in the South from the levels of the prior month.
The three-month weighted moving average of starts was up 36 percent for the country-as-a-whole on a year-over-year basis. Compared to October 2020, starts were up 82 percent in the Northeast, 41 percent in the West, 29 percent in the Midwest and 24 percent in the South.
The following chart shows the starts by region for the last 25 months.
Multifamily housing completions higher but still weak
The preliminary October multifamily housing unit completions figure in buildings with 5 or more units per building was 302,000 units on a seasonally adjusted, annualized basis. This was reported to be up 4 percent (12,000 units) from September’s revised figure. However, September’s preliminary completions figure was revised upward by 10,000 units, so the rise in completions was stronger than the reported 4 percent rise would indicate.
Compared to October 2020, which was a particularly strong period for completions, multifamily housing completions in buildings with 5 or more units per building were down 32 percent. Compared to the trailing 12-month average, completions were down 19 percent and compared to the monthly average for 2019, completions were down 13 percent.
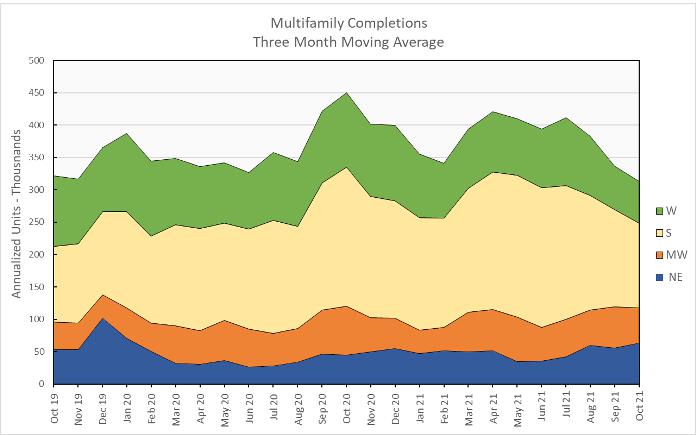
For the country as-a-whole, multifamily housing construction completions (two or more units per building) were down 7 percent month-over-month, comparing three-month weighted moving averages. The three-month weighted moving averages of completions was up 13 percent in the Northeast, but fell 4 percent in the West and 13 percent in both the South and the Midwest.
On a year-over-year basis, the three-month weighted moving average of completions in buildings with 2 or more units per building was down 30 percent nationally. Completions were up 42 in the Northeast but fell 28 percent in the Midwest, 39 percent in the South and 44 percent in the West.
Completions by region for the past 25 months are shown in the chart below.
All data quoted are based on seasonally adjusted results and are subject to revision.


