

The Census Bureau’s report on construction spending shows that the value of residential construction put in place in September was up 19 percent year-over-year but fell 0.4 percent month-over-month.
Passing the peak
The reported value of total private residential construction put in place in September 2021 came in at $774 billion on a seasonally adjusted, annualized basis. This figure, which includes spending on both new construction and on improvements, was reported to be down $3.2 billion from August’s revised figure. However, the preliminary figure reported for August was revised downward by $9.8 billion, so the preliminary figure for September is actually $12.3 billion lower than the preliminary figure for August reported last month.
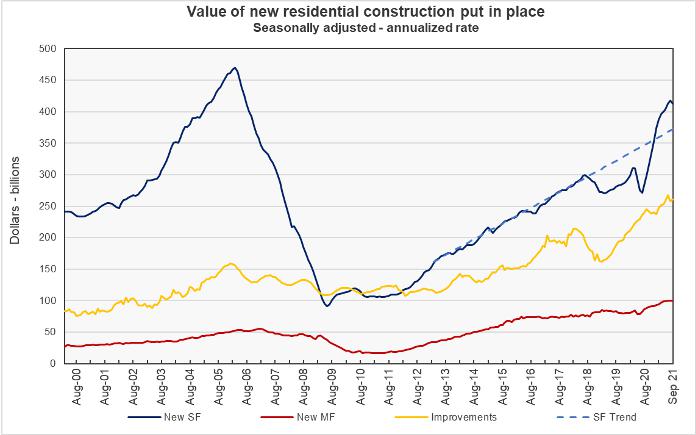
The value of new private multifamily residential construction put in place in September was reported to be $100 billion on a seasonally adjusted, annualized basis. This was reported to be down $290 million from the revised level for August, but only because the preliminary figure for August was revised upward by $867 million this month. The value of multifamily residential construction put in place in September 2021 was 10.5 percent higher than the level of September 2020.
State and local governments were reported to have put 7.4 billion in multifamily residential construction in place in September on a seasonally adjusted annualized basis.
The value of new single-family residential construction put in place in September was $412.7 billion on a seasonally adjusted, annualized basis. This was down 0.6 percent from the revised level for August but was up 30.4 percent from the level of September 2020.
The value of improvements to residential buildings put in place in September was reported to be $260.8 billion on a seasonally adjusted, annualized basis. This was up 8.1 percent from the year-earlier level but was down 0.1 percent from the revised level for August, despite that figure being adjusted sharply lower this month. The revised level for improvements put in place in August was $12.6 billion (4.6 percent) lower than the preliminary level reported last month. The Census Bureau does not separate out improvements for single-family and multifamily residential buildings.
Charting the data
The first chart, below, shows the history of new private residential construction spending since January 2000 for single-family housing, multifamily housing and residential improvements. It also shows a trendline for single-family construction based on the relatively steady growth in the value of construction put in place between 2013 and 2018.
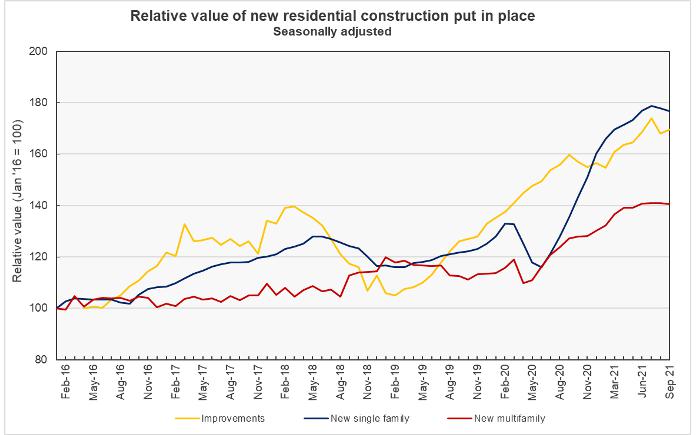
The final chart focuses on the period since January 2016. In this chart, the value of the private construction put in place for the three categories of residential construction are normalized so that the readings for January 2016 equal 100. This chart shows more clearly that the value of both single-family and multifamily housing put in place has been in a slow decline in recent months.
The most recent Census report on unit completions indicates that multifamily completions have fallen sharply in recent months, with September unit completions running 18 percent below the level of August. Given that report, it is surprising that the reported drop in the value of new multifamily housing construction put in place in September was not larger.
The report from the Census Bureau also includes information on spending on other types of construction projects. The full report can be found here.


