

The latest rent report from Apartment List shows that rent growth is still at a high, if decelerating, pace. Nationally, rents were up 0.8 percent for the month and nearly 16 percent for the year.
Rent increases continue
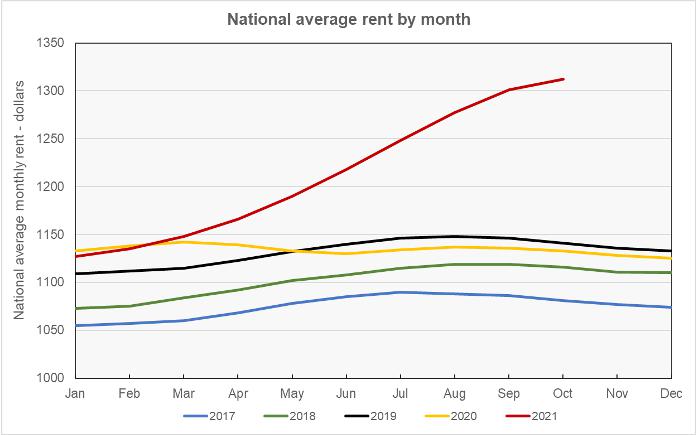
The first chart, below, shows the annual pattern of rent growth for the years for which Apartment List has data. The usual pattern is for rents to rise in the spring and summer and fall slightly in the autumn and winter months, with the average rent edging up each year. The year 2021 uncharacteristically started with rents lower than those of the prior year, but rents have risen at a record pace since then.
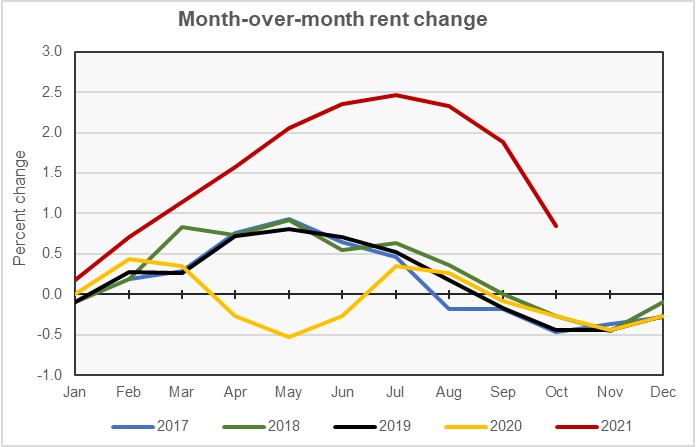
Apartment List cites falling vacancy rates as a key factor in the recent behavior of rents. The vacancy rate was near 6 percent in late 2019, shortly before the pandemic. It rose as high as 7.1 percent in April 2020 only to begin a downward trend. Vacancies fell below their pre-pandemic level at the end of 2020 and continued to fall, reaching 3.8 percent in August 2021. Since then, vacancies have started to move slowly higher. The vacancy rate was 4.1 percent in October according to Apartment List.
The effect of vacancies on rents is visible in the next chart, which plots the month-over-month change rate of the national average rent. Rents fell month-over-month as the vacancy rate jumped but rose as the vacancy rate fell. The month-over-month rate of rent growth has been falling recently, in tandem with the rising vacancy rate.
Core versus metro
Apartment List provides the underlying data they collected in compiling their report and that data was used to create the tables, below. The tables look at the 50 largest metropolitan statistical areas by population as defined by the US Census Bureau and identify the top 10 metros for year-over-year rent increases and the bottom 10 metros for year-over-year rent decreases. They provide the average monthly rent in the metro, the annual percentage change in rent (YoY Metro) along with the percentage change from the prior month’s rent level (MoM Metro). They also list the year-over-year percentage change in rent for the core city in each metro area (YoY Core).
The first table shows the 10 metros with the largest annual rent decreases. Despite these metros being the current rent growth laggards, all of them and all of their core cities experienced positive rent growth year-over-year. Some of the metros did see rents decline month-over-month, but that would not be considered unusual for this time of the year in a normal year. In this year, only 9 of the 50 largest metros saw month-over-month rent declines in October.
| Metro | Metro Rent | YoY Metro | MoM Metro | YoY Core |
| Minneapolis | 1304 | 4.6 | -0.15 | 1.9 |
| Louisville | 1001 | 7.1 | 0.60 | 6.4 |
| San Francisco | 2270 | 7.4 | -0.57 | 9.7 |
| Milwaukee | 1073 | 7.9 | 0.09 | 5.9 |
| Kansas City | 1174 | 9.0 | 0.09 | 7.4 |
| Cleveland | 968 | 9.1 | -0.10 | 3.7 |
| Pittsburgh | 1015 | 9.3 | 0.00 | 9.5 |
| San Jose | 2444 | 9.5 | -0.37 | 8.1 |
| St Louis | 1098 | 9.5 | 0.18 | 5.9 |
| Houston | 1252 | 10.0 | 0.40 | 9.5 |
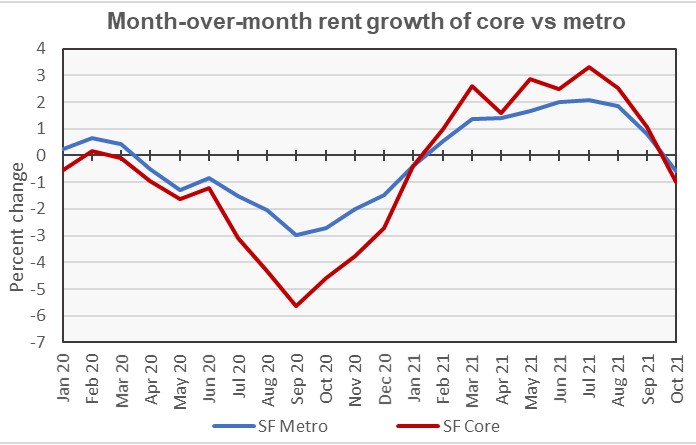
The next chart illustrates the month-over-month rent growth for San Francisco, both for the core city and for the metro area. It shows that the core city was much more impacted by the downturn last year than was the metro area as-a-whole, but the situation reversed around the turn of the year. Still, San Francisco metro area rents are down 4.8 percent and core city rents are down 11.9 percent compared to their levels in March 2020.
The metros in the top 50 by population with the largest year-over-year rent increases are listed in the next table, below. Fast growing sunbelt cities are well represented in this table. The rates of year-over-year rent growth occurring in these metros is stunning.
| Metro | Metro Rent | YoY Metro | MoM Metro | YoY Core |
| Tampa | 1711 | 32.6 | 1.00 | 34.5 |
| Phoenix | 1711 | 28.7 | 1.66 | 27.4 |
| Miami | 1925 | 28.1 | 2.45 | 27.5 |
| Las Vegas | 1642 | 26.6 | 1.80 | 26.6 |
| Jacksonville | 1532 | 26.1 | 0.99 | 26.0 |
| Orlando | 1681 | 25.6 | 1.33 | 28.0 |
| Austin | 1682 | 24.0 | 0.84 | 24.2 |
| Atlanta | 1573 | 23.9 | 1.42 | 19.1 |
| Raleigh | 1511 | 22.8 | 0.60 | 23.2 |
| Inland Empire* | 2028 | 21.9 | 0.70 | 25.2 |
*Riverside-San Bernardino-Ontario
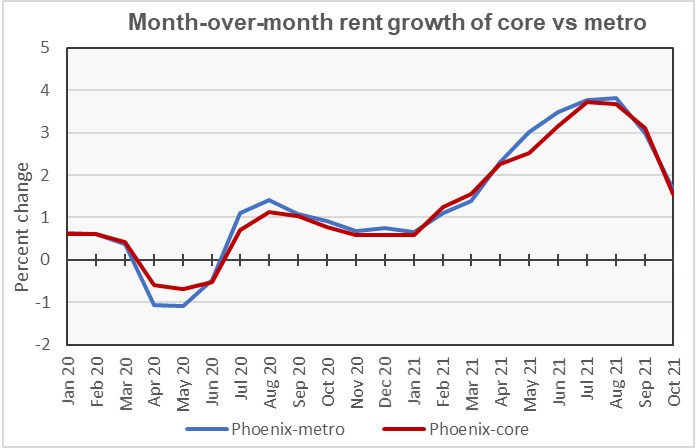
The last chart illustrates the month-over-month rent growth for Phoenix, both for the core city and for the metro area. It shows that the core city was only slightly more impacted by the downturn when the pandemic first emerged than was the metro area as-a-whole. Since then, rent growth again turned positive and the core city and metro area rents have moved together. Since March 2020, Phoenix core city rents are up 29.7 percent while metro area rents are up 31.1 percent.
The complete Apartment List report covers many more metros and contains some interesting charts illustrating how rents have changed over time in the hardest hit markets. It also provides readers with the opportunity to download their data sets. It can be found here.


