

The Census Bureau’s report on construction spending shows that the value of residential construction put in place in October was down 0.5 percent from the revised level of the month before. However, spending was up 20 percent year-over-year.
Did residential construction spending fall? It depends
The reported value of total private residential construction put in place in October 2021 came in at $774.7 billion on a seasonally adjusted, annualized basis. This figure, which includes spending on both new construction and on improvements, was reported to be down $3.8 billion from September’s revised figure. However, the preliminary figure reported for September was revised upward by $5.0 billion, so the preliminary figure for October is actually up by $1.2 billion from the preliminary figure for September reported last month.
The value of new private construction of multifamily residential buildings put in place in October was reported to be $100.1 billion on a seasonally adjusted, annualized basis. This was reported to be down $123 million from the revised level for September, but only because the preliminary figure for September was revised upward by $194 million this month. The value of multifamily housing construction put in place in October 2021 was 10.6 percent higher than the level of October 2020.
State and local governments were reported to have put $7.3 billion in multifamily residential construction in place in October on a seasonally adjusted annualized basis.
The value of new single-family residential construction put in place in October was $412.1 billion on a seasonally adjusted, annualized basis. This was down 0.8 percent from the revised level for September but was up 30.3 percent from the level of October 2020.
The value of improvements to residential buildings put in place in September was reported to be $262.5 billion on a seasonally adjusted, annualized basis. This was up 7.1 percent from the year-earlier level but was down 0.5 percent from the revised level for September. The Census Bureau does not separate out improvements for single-family and multifamily residential buildings.
Charting the data
The first chart, below, shows the history of new private residential construction spending since January 2000 for single-family housing, multifamily housing and residential improvements. It also shows a trendline for single-family construction based on the relatively steady growth in the value of construction put in place between 2013 and 2018.
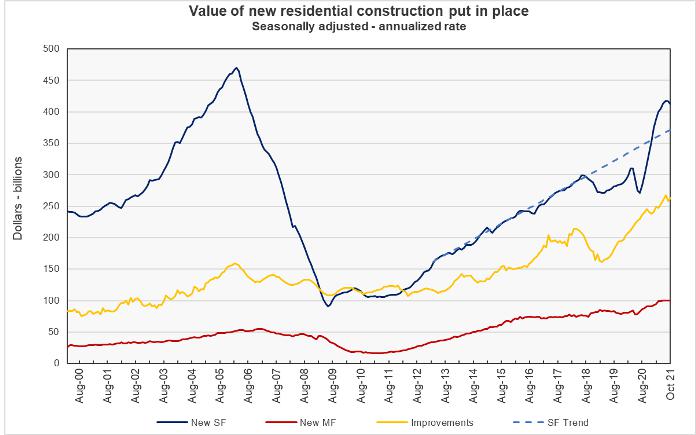
The chart shows the strong rebound in the value of completions of single-family housing since the shutdowns in 2020. However, the value of single-family completions seems to have crested recently and has declined for the last two months.
The final chart focuses on the period since January 2016. In this chart, the value of the private construction put in place for the three categories of residential construction are normalized so that the readings for January 2016 equal 100. This chart shows more clearly that the value of multifamily housing put in place appears to have reached a plateau and has been running at nearly the same level since April.
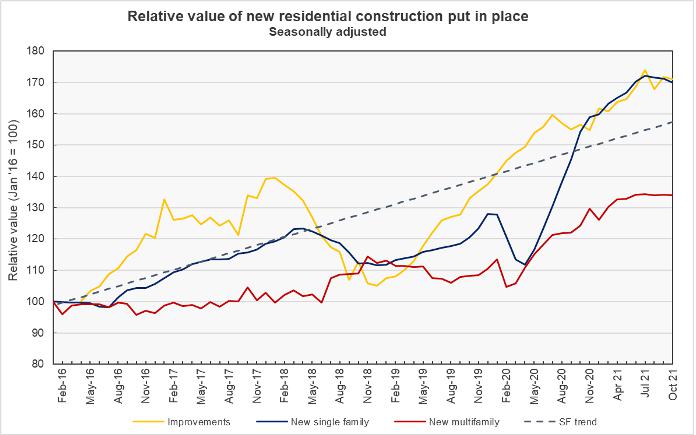
Recent reports from the Census Bureau indicate that the number of multifamily housing unit completions has been declining since July. Given this situation, the fact that the value of new multifamily housing construction put in place in recent months has not declined is somewhat unexpected.
The report from the Census Bureau also includes information on spending on other types of construction projects. The full report can be found here.


