

A report from the Mortgage Bankers’ Association (MBA) says that there was a sharp rise in multifamily mortgage originations in Q4 both on a quarter-over-quarter and on a year-over-year basis.
Tracking multifamily mortgage originations
The first chart, below, shows the quarterly origination volume indices since Q1 2018 for both commercial mortgages and for multifamily mortgages as reported by the MBA. The indices are reported relative to the year 2001, with the average quarterly volume in that year defined as a value of 100.
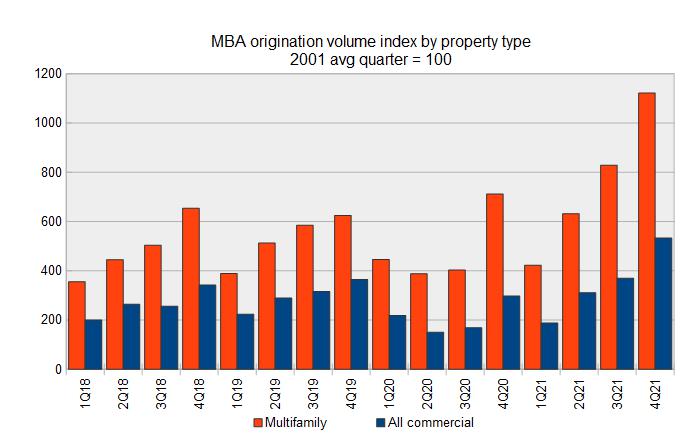
The data show a clear pattern of seasonality with the volume of originations rising during each quarter of the year only to drop back down in the first quarter of the next year. In addition, the origination volume in a given quarter of a year is generally higher than that of the same quarter of the year before. Between 2017 and 2019, this year-over-year growth averaged about 16 percent for multifamily mortgages. These patterns did not hold in 2020 when the pandemic disrupted the operations of the property sales and financing markets.
The MBA reported that the multifamily mortgage origination index for Q4 2021 was 1,122. This was up 35 percent from its level in Q3 and was up 58 percent from its level in Q4 2020. Compared to Q4 2019, the index was up 80 percent.
The MBA originations index for commercial properties as-a-whole for Q4 2021 was 533. This was up 44 percent from its level in Q3 and was up 79 percent compared to its level in Q4 2020. It was 46 percent higher than its reading in Q4 2019. The growth in mortgage originations for commercial property as a single asset class was more heavily impacted in 2020 by the pandemic than was the growth of multifamily mortgages, so the comparisons of the levels of current originations for commercial mortgages to those in 2020 benefit from a lower basis for comparison than for multifamily mortgages.
Sources of funds
The MBA report also includes data on the sources of the mortgages being originated. It provides data on five categories of lenders: commercial mortgage-backed securities (CMBS) and conduits; commercial banks; life insurance companies; the government sponsored entities (GSEs), Fannie Mae and Freddie Mac; and investor-driven lenders such as REITs and specialty finance companies. As before, the index values are quoted relative to the average quarterly origination volumes in the year 2001. The index values of different originators cannot be used to compare their absolute levels of mortgage originations since their origination levels in the baseline year of 2001 were different. However, the index values can be compared to see which originators are growing their businesses and which are not.
The next chart, below, shows that the GSEs maintained their lending levels between Q2 2020 and Q1 2021, during the worst of the pandemic. Most of the other lenders pulled back during that time. However, since Q1 2021, all categories of commercial property lenders have been increasing their supply of funds to the market.
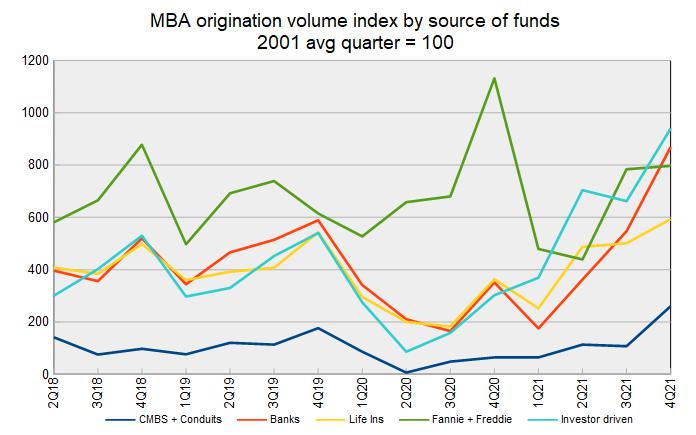
Readers of the report on the dollar value of commercial mortgage debt outstanding know that the GSEs and commercial banks are the largest providers of mortgage funds. However, in Q4 the GSE’s increased their originations by only 2 percent compared to Q3 while commercial banks increased their originations by 59 percent. The other providers increased their mortgage originations at rates from 18 percent for life insurers to 143 percent for CMBS and conduits.
The full report from the MBA includes additional information on lending for other commercial property types. It can be found here.


