

A new report from Real Capital Analytics (RCA) said that multifamily property prices rose 22.5 percent year-over-year in January and that they rose 1.9 percent from the month before.
Defining CPPI
Real Capital Analytics tracks an index they call the Commercial Property Price Index (CPPI). The index is computed based on the resale prices of properties whose earlier sales prices and sales dates are known. The index represents the relative change in the price of property over time rather than its absolute price. Note that, as properties are added to the RCA dataset each month, they recalculate the CPPI all the way back to the beginning of the data series, which begins in December 2000.
Prices rise at record rates
The 22.5 percent reported increase in the CPPI for apartments is considered a new record high, the fifth in a row, for RCA’s data set. However, readers of last month’s report may recognize that the year-over-year CPPI increase quoted in that report was higher. Additions to the dataset or changes to the seasonal adjustment factors caused the year-over-year change in the CPPI for December to be revised downward from 23.6 percent in last month’s report to 21.4 percent in this month’s report.
Price appreciation in December for all commercial property as a single asset class was 1.6 percent month-over-month and 20.3 percent year-over-year.
Price appreciation for industrial properties was 2.4 percent for the month and 28.1 percent over the past 12 months, once again the highest rates of any commercial property type covered. Office buildings as a single property class experienced price appreciation of 0.4 percent for the month and 11.8 percent for the last 12 months, with suburban offices appreciating 11.5 percent year-over-year. Office buildings within central business districts (CBDs) were again the worst performing commercial property sector that RCA tracks, with a price increase of only 0.3 percent for the month and 5.0 percent over the prior 12 months.
Tracking price appreciation
The first chart, below, plots the year-over-year change in the values of the CPPI since January 2012 for all commercial property as a single asset class and for apartments. The chart shows that the recent runup in apartment prices is carrying over into that of all commercial property when considered as a single asset class.
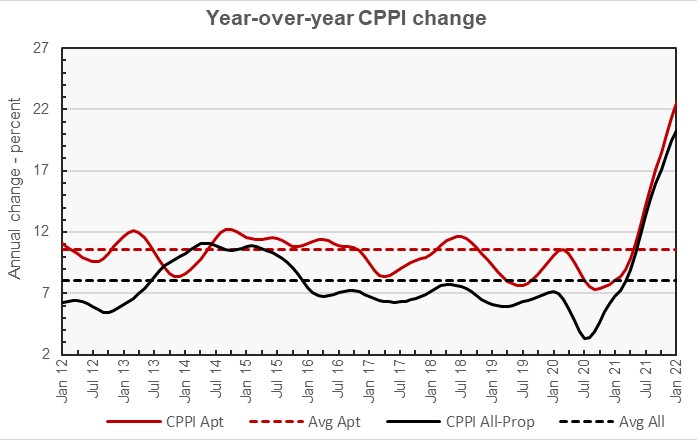
The chart also shows the average rates of annual appreciation in the indexes for the two property classes. The average annual appreciation for apartments since January 2012 is 10.6 percent, while the average annual appreciation rate for all commercial property as a single asset class is 8.1 percent.
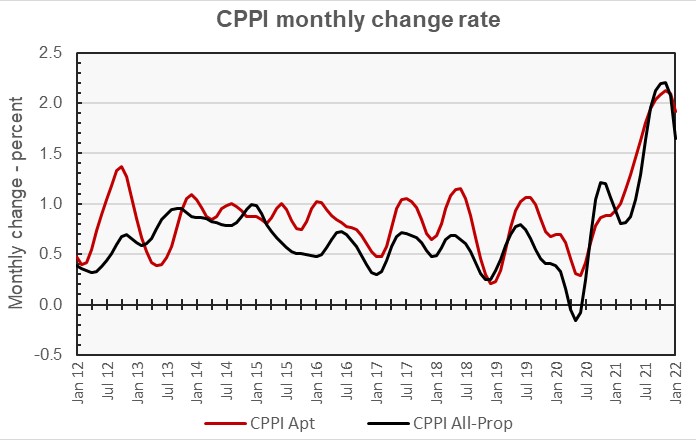
The next chart, below, plots the month-over-month change in the value of the CPPI since January 2012 for all commercial property as a single asset class and for apartments. The chart shows that, even though the annual rate of increases in the indexes may still be setting records, the monthly rates of increases in the indexes have crested and are now declining.
Major metros lag
The RCA report provides data comparing the price changes of commercial property in 6 major metro areas* against those in the rest of the country, although it does not separate out apartment prices from those of other commercial property types in this comparison. The last chart, below, plots the year-over-year rate of price appreciation for the two types of properties since January 2012. It also plots the average rates of price appreciation for the two types of properties over that time period.
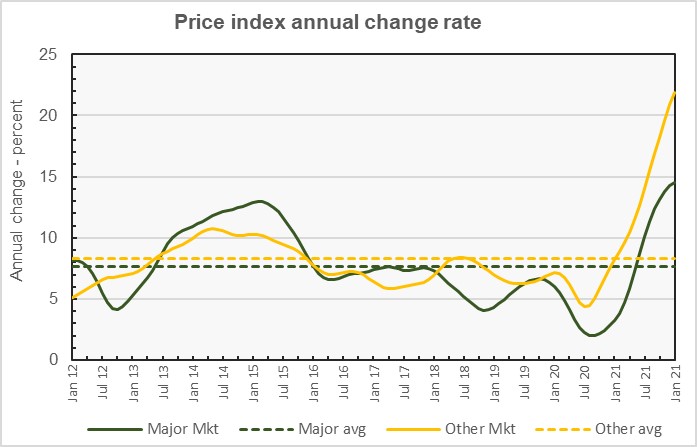
The chart shows that price appreciation in the non-major markets has significantly outperformed that in the major markets recently, but that the long-term average rates of price appreciation for the two types of property are not that different.
By the numbers, price appreciation for commercial property in major markets was reported to be 0.9 percent for the month and 14.6 percent for the year. Price appreciation for commercial property in non-major markets was reported to be 1.9 percent for the month and 21.9 percent for the year. The long-term average annual price appreciation for the major markets was 7.7 percent while that for the non-major markets was 8.3 percent.
The full report provides more detail on other commercial property types. Access to the RCA report can be obtained here.
*The major metros are Boston, Chicago, Los Angeles, New York, San Francisco and Washington DC.


