

A new report from CoStar says that multifamily property prices have resumed their recent rapid rise after a brief slowdown in the middle of last year.
CCRSI defined
The CoStar report focuses on a relative measure of property prices called the CoStar Commercial Repeat Sales Index (CCRSI). The index is computed based on the resale of properties whose earlier sales prices and sales dates are known. The index represents the relative change in the price of property over time rather than its absolute price. CoStar identified 1,469 repeat sale pairs in January for all property types. These sales pairs were used to calculate the results quoted here.
Price growth is positive
CoStar reported that its value-weighted index of multifamily property prices increased 24.3 percent year-over-year in January 2022. The index was up 0.9 percent month-over-month.
The combined value-weighted index of non-multifamily commercial property rose by 15.0 percent year-over-year in January. The index rose 1.4 percent month-over-month. The other commercial property types tracked by CoStar are office, retail, industrial and hospitality.
Comparing property types
The first chart, below, shows the history of the value-weighted CCRSI’s for multifamily property and for all other commercial property considered as a single asset class since January 2000. It also shows the trend line for the growth in the multifamily CCRSI based on its growth in the period from January 2012 to January 2020. The indexes are normalized so that their values in December 2000 are set to 100.
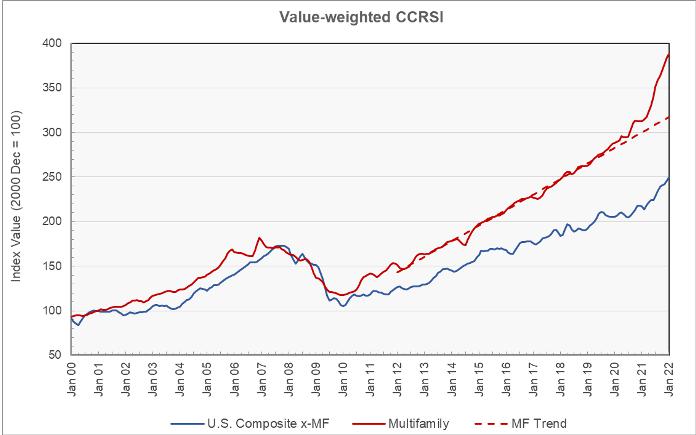
The chart show that both indexes have shown steady growth since the depths of the housing bust in 2010. It also shows that the growth in multifamily property prices exceeded the trend line even during the pandemic year of 2020. In 2021, the divergence between the actual multifamily property price growth and its long-term trend widened significantly.
The second chart shows the year-over-year change in the value-weighted multifamily property price index and that for all other commercial property types since January 2012. It also shows the average rates of annual price growth for the two property classes over that time.
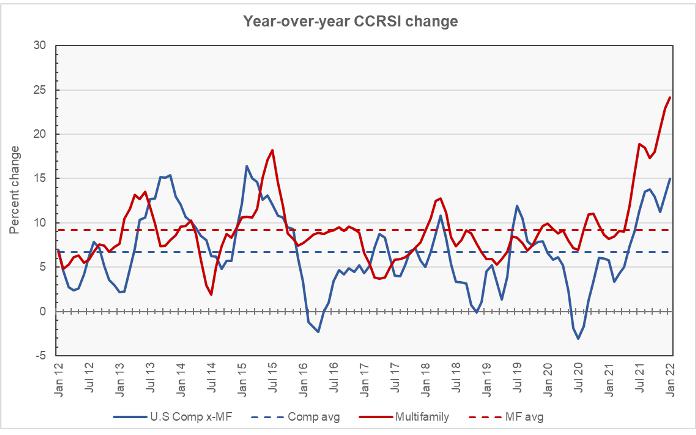
The chart shows that the annual growth for multifamily property prices has exceeded that for other commercial property over the last 10 years. The average annual increase in multifamily property prices has been 9.2 percent while that of other commercial property has been 6.7 percent. These rates of increase are slightly less than those reported elsewhere by Real Capital Analytics.
Transaction volumes moderating
CoStar reported that number of repeat-sale transactions were down significantly in January, falling 53 percent from December’s 3,106 transactions. Transaction dollar volume was also down significantly in the month, falling 64 percent to $13.7 billion. However, transacted prices remained high relative to asking prices at 94.7 percent and average days-on-market remained relatively low at 218 days, both signs of good market liquidity.
The full report discusses all commercial property types, but detailed data on each of the property types and regional data are only reported quarterly and so are not included in this month’s report. While the CoStar report provides information on transaction volumes, it does not break out multifamily transactions. The latest CoStar report can be found here.


