

A new report from CoStar says that the rate of growth in multifamily property prices declined in February while the prices of other commercial property actually fell month-over-month.
CCRSI defined
The CoStar report focuses on a relative measure of property prices called the CoStar Commercial Repeat Sales Index (CCRSI). The index is computed based on the resale of properties whose earlier sales prices and sales dates are known. The index represents the relative change in the price of property over time rather than its absolute price. CoStar identified 1,349 repeat sale pairs in February for all property types. These sales pairs were used to calculate the results quoted here.
Year-over-year price growth remains positive
CoStar reported that its value-weighted index of multifamily property prices increased 24.1 percent, year-over-year, in February 2022. The index was up 0.1 percent month-over-month.
The year-over-year price increase for multifamily property is in line with that reported earlier by Real Capital Analytics (RCA). However, RCA found a much higher month-over-month rate of price growth in February than did CoStar.
The value-weighted index of non-multifamily commercial property rose by 17.2 percent, year-over-year, in February. The index fell 0.1 percent month-over-month, the first monthly decline in a year. The other commercial property types tracked by CoStar are office, retail, industrial and hospitality.
Comparing property types
The first chart, below, shows the history of the value-weighted CCRSI’s for multifamily property and for all other commercial property considered as a single asset class since January 2000. The indexes are normalized so that their values in December 2000 are set to 100. The chart also shows the trend lines for the growth in the multifamily and commercial CCRSI’s based on their rate of growth in the period from January 2012 to January 2020.
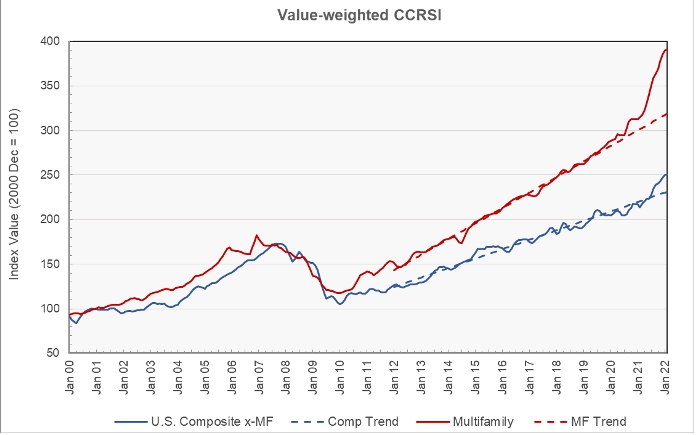
The chart show that both indexes maintained remarkably steady growth from 2012 to 2020, although multifamily grew at a faster rate. The rate of growth in multifamily property prices began to exceed its long-term trend starting in early 2020 while the rate of growth of other commercial property prices began to exceed its long-term trend in early 2021.
The second chart shows the year-over-year change in the value-weighted multifamily property price index and that for all other commercial property types since January 2012. It also shows the average rates of annual price growth for the two property classes over that time. These averages are calculated using data through February 2022, so they include the recent run-up in prices.
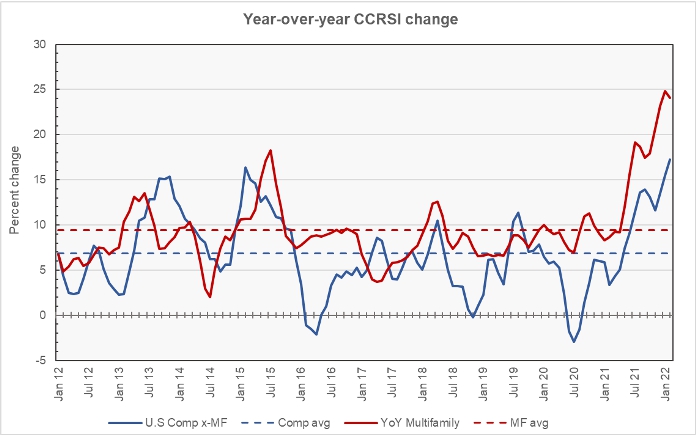
The chart shows that the annual growth for multifamily property prices was 9.4 percent while that of other commercial property was 6.8 percent.
Transaction volumes fall
CoStar reported that number of repeat-sale transactions were down again in February, falling 17 percent from January’s level. Transaction dollar volume was also down in the month, falling 23 percent to $11.1 billion.
The full report discusses all commercial property types, but detailed data on each of the property types and regional data are only reported quarterly and so are not included in this month’s report. While the CoStar report provides information on transaction volumes, it does not break out multifamily transactions. The latest CoStar report can be found here.


