

A recent report by the U.S. Department of the Treasury states that, as of the end of January 2022, 69 percent of the $25 billion in emergency rental assistance funds allocated under the Consolidated Appropriations Act, 2021 had been spent or obligated. This act was passed in the last days of 2020. Of the $21.55 billion allocated for rental assistance under the American Rescue Plan Act of 2021, 26 percent had been spent or obligated by the end of January. This act was passed March 11, 2021.
Program review
An overview of the programs was given in an earlier article on this subject. Readers interested in reviewing the outlines of the programs should look there.
The Treasury refers to the emergency rental assistance program established under the Consolidated Appropriations Act, 2021 as ERA1 and the program established under the American Rescue Plan Act of 2021 as ERA2. This nomenclature is used in the charts displayed below.
Mapping the assistance flow
The first chart, below, shows the number of households receiving emergency rental assistance each month since program inception. However, for each of the programs, the first bar represents several months of activity as the program got going. In the case of ERA1, the first bar represents assistance granted between January 1 and March 31, 2021. In the case of ERA 2, the first bar represents assistance granted between April 1 and June 30, 2021.
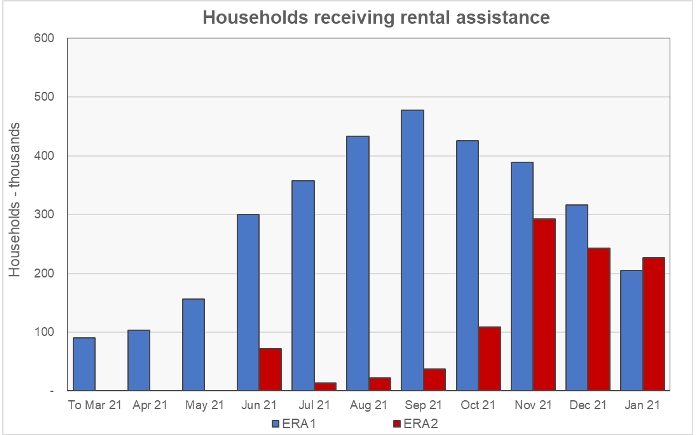
The chart shows that it took some time for the programs to ramp up. It is interesting that the number of household receiving emergency rental assistance under ERA1 peaked in September, shortly after the U.S. Supreme Court struck down the CDC’s eviction moratorium.
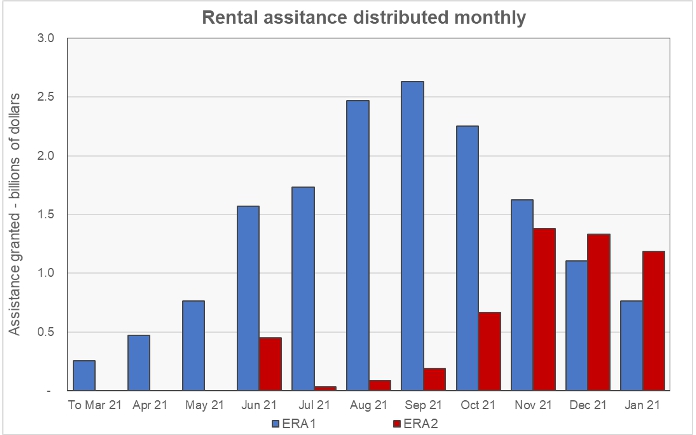
The second chart, below, shows the rate at which assistance dollars have been going out the door. Despite the U.S Treasury modifying its guidance in late August in order to expedite the delivery of aid, the aid flow did not accelerate after that time. The rate of aid delivery under ERA1 fell after September. The rate of aid delivery under ERA2 climbed rapidly until November but has been declining since then.
What’s left?
The last chart shows the cumulative aid delivered under the two programs along with the maximum aid levels the programs made available. The spending levels shown do not account for dollars allocated for administrative expenses or other distributions allowed under the programs. For the ERA1 program, this additional spending has amounted to a little under 10 percent of the spending on rental assistance. For the ERA 2 program, the additional spending has amounted to less than 4 percent of the spending on rental assistance.
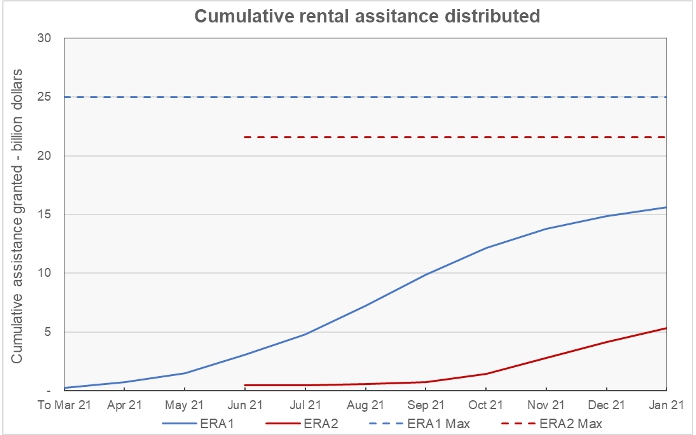
The chart shows that neither program has come close to distributing all of the money allocated to it. Qualifying residents who are behind on their rent and who have no other means of paying it can be encouraged to apply for emergency rental assistance in order to meet their obligations to their landlords.


