

The January Job Openings and Labor Turnover (JOLT) report from the Bureau of Labor Statistics (BLS) said that the number of job openings remained high for the month while hiring was flat.
Overall jobs market shows gains
For a discussion of the JOLT report and how it relates to the Employment Situation Report, please see the paragraph at the end of this article.
The BLS reported that there were 11.3 million job openings at the end of January, up by 338,000 from the preliminary level reported last month. This figure would have been an all-time series high except for an update made to the job openings figure for December, which was revised higher by 523,000 openings. Part of the reason for the revision to December’s figure was the annual benchmarking adjustments that the BLS makes in January of every year. As part of this benchmarking process, the figures for the most recent 5 years were revised to reflect the latest employment statistics estimates and updated seasonal adjustment factors.
The January job openings figure represents 7.0 percent of total employment plus job openings. For comparison, the unemployment rate in January was 4.0 percent and 6.5 million people were unemployed. Another 5.7 million people said in January that they would like a job but they were not counted as being in the labor force since they were not actively seeking employment.
The number of people hired for a new job in January was 6.46 million, while the number of people leaving their old jobs was 6.06 million. Of those leaving their jobs, 4.25 million quit voluntarily, while 1.41 million people were involuntarily separated from their jobs. The remainder of people leaving their jobs left for other reasons, such as retirements or transfers. The portion of people quitting their jobs fell slightly to 2.8 percent of the labor force. The involuntary separations rate edged upward to 0.9 percent.
Construction jobs fall
The first chart, below, shows the employment situation for the construction jobs market over the last 37 months. It shows that January saw a net decline of 7,000 jobs. In addition, December’s jobs gain was revised downward (-11,000) to 32,000 jobs.
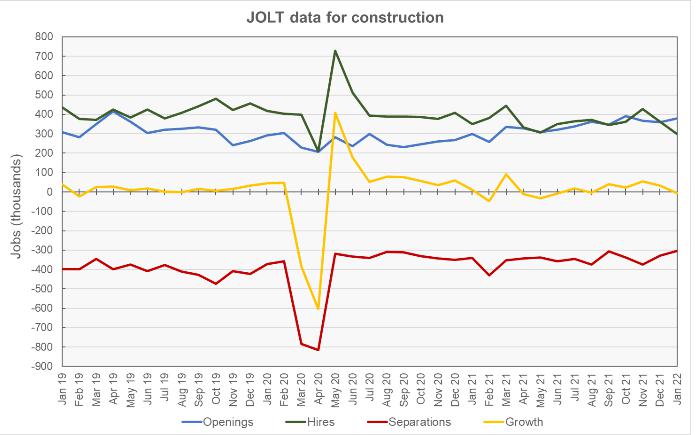
Construction jobs openings in January were reported to be 380,000 jobs, 27 percent higher than the year-earlier level. On a month-over-month basis, openings for construction jobs were reported to rise by 21,000 openings, or 6 percent, despite December’s figure being revised upward by 22,000 openings. Job openings in the construction category represent 4.8 percent of total employment plus job openings.
Hiring was reported to be down 63,000 jobs in January from December’s revised (-12,000 jobs) figure. The BLS reported that 298,000 construction jobs were filled in January, 15 percent below the year-earlier figure.
Construction jobs separations were reported to fall by 24,000 jobs in January to 305,000 jobs. Quits fell by 39,000 jobs to 146,000 jobs. Layoffs were reported to rise by 17,000 to 150,000 jobs. “Other separations” which includes retirements and transfers, were reported fall by 2,000 jobs from December’s revised figure to 10,000 jobs. Quits represented 48 percent of separations for the month.
RERL jobs growth continues positive
The last chart, below, shows the employment situation for the real estate and rental and leasing (RERL) jobs category. Employment growth in this jobs category was 7,000 jobs. Based on the revised figures in January’s report, employment growth has been positive for this jobs category since May 2020.
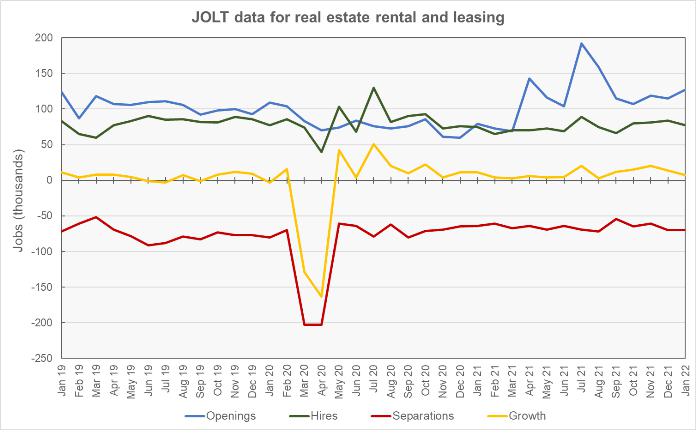
The number of job openings in the RERL category was 127,000 jobs at the end of January, up 12,000 jobs from the revised level (-13,000 openings) of the month before. Job openings in January were 48 percent higher than their year-earlier level. Job openings in the RERL category represent 5.2 percent of total employment plus job openings.
Hiring in January was down by 7,000 jobs from December’s revised (+8,000) level at 77,000 jobs. This hiring figure was 3 percent above the year-earlier level.
Separations in the RERL jobs category in January were unchanged from December’s figure at 70,000 jobs. Quits were up 11,000 from December’s revised (-3,000 jobs) figure to 60,000. Quits represented 86 percent of total separations in January.
The numbers given in the JOLT report are seasonally adjusted and are subject to revision. It is common for small adjustments to be made in subsequent reports, particularly to the data for the most recent month. The full current JOLT report can be found here.
Comparing the reports
The US labor market is very dynamic with many people changing jobs in any given month. The JOLT report documents this dynamism by providing details about job openings, hiring and separations. However, it does not break down the jobs market into as fine categories as does the Employment Situation Report, which provides data on total employment and unemployment. For example, while the Employment Situation Report separates residential construction from other construction employment, the JOLT report does not. The Employment Situation Report separates residential property managers from other types of real estate and rental and leasing professionals, but the JOLT report does not. However, the JOLT report provides a look at what is driving the employment gains (or losses) in broad employment categories.


