

The latest Employment Situation Report from the Bureau of Labor Statistics stated that the number residential construction jobs rose for the month, but apartment operations jobs fell.
Total employment rises
The BLS reported that employment increased by 678,000 jobs in February, based on their survey of business establishments. The establishment survey found that the number of employed persons is still 2.9 million below its pre-pandemic level.
The BLS also reported that the US unemployment rate ticked back down to 3.8 percent in February. This metric is derived from a separate survey of households. That survey found that the number of unemployed persons fell by 243,000, reversing last month’s rise. However, the number of unemployed persons is still 553,000 above the pre-pandemic level.
The household survey found that the number of people in the civilian labor force grew by 304,000 during the month while the adult population rose by 122,000. The labor force participation rate rose to 62.3 percent. It had been at 63.4 percent before the pandemic. Recovering that 1.1 percent decline in participation would bring 2.9 million more people into the workforce.
The BLS reported more detailed employment information on four job categories of interest to the multifamily industry. These are employment as residential construction workers, as specialty trades within residential construction, as residential property managers and as lessors of residential buildings. As usual, some of the data is reported with a month delay, so the latest figures for the latter two categories are for the month of January.
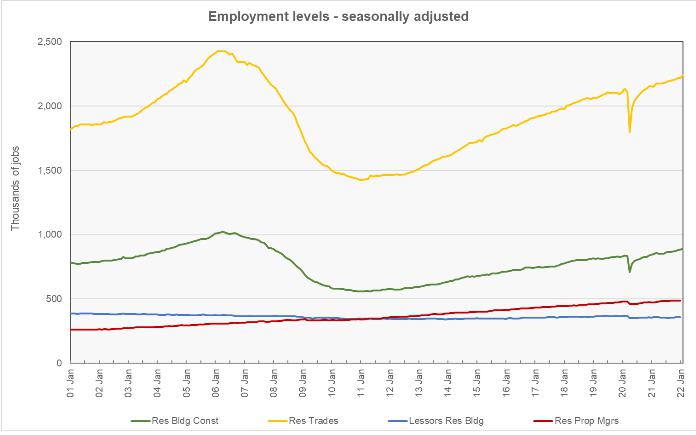
The first chart shows the long-term history of the levels of employment in these four jobs categories.
Construction jobs up for the month
Employment in residential building construction in February, usually with general contractors, was reported to be up 6,700 jobs (0.8 percent) from the revised employment level for January at 891,100 jobs. However, January’s employment figure was revised upward by 1,100 jobs, so February’s preliminary employment is actually 7,800 jobs higher than the preliminary figure reported for January reported last month. Employment in this category is up 5.0 percent year-over-year and is now 6.2 percent higher than its level in February 2020, before the effects of the pandemic were felt.
Employment in residential building trades, i.e. plumbers, electricians, etc., in January was reported to be up 24,300 jobs (1.1 percent) from January’s revised figure at 2,243,500 jobs. In addition, January’s preliminary employment figure was adjusted upward by 15,900 jobs. Employment in this category is up 4.3 percent year-over-year and is now 5.1 percent above its level in February 2020.
Total employment in these two categories of residential construction jobs combined was up 1.0 percent in February from the revised level of the month before and was 5.4 percent above its level in February 2020.
Apartment operations jobs down overall
Employment for residential property managers in January was reported to be up by 900 jobs (0.2 percent) from its level for December to 488,600 jobs. However, the December jobs figure was revised downward by the same amount, so the preliminary figure for January is unchanged from the preliminary figure for December reported last month. Employment for residential property managers is up 3.2 percent year-over-year and is up from its February 2020 level by 1.6 percent.
Employment for lessors of residential buildings was reported to fall in January by 2,100 jobs (0.6 percent) to a level of 359,900 jobs. In addition, the preliminary employment level reported for December was revised downward by 500 jobs. Employment in this category is still up 1.0 percent year-over-year, but is now 2.4 percent below its pre-pandemic level.
Total employment in these two categories of apartment operations jobs combined was down 0.14 percent for the month and is now 0.15 percent below its level in February 2020.
Taking a closer look
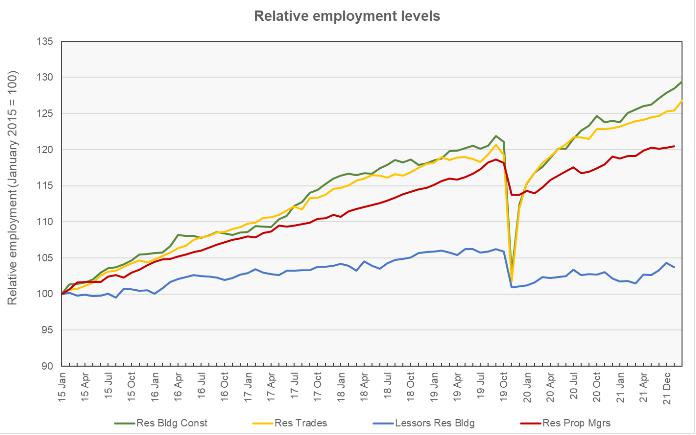
The final chart, below, presents the employment data in a slightly different format. It normalizes the employment levels in all four jobs categories to a reading of 100 for January 2015. This presentation makes recent changes in employment levels in these categories more visible.
The numbers given in the Employment Situation report are seasonally adjusted and are subject to revision. It is common for small adjustments to be made in subsequent reports, particularly to the data for the most recent month. The current Employment Situation report can be found here.


