The “Week 42” edition of the Census Bureau’s Pulse Survey has been released. It shows that the portion of renters with rent delinquencies moved slightly higher since we last reported on this survey.
What is the Pulse Survey?
The Pulse Survey is an experimental program that the Census Bureau started shortly after economic shutdowns were imposed in response to COVID-19. It was designed to assess how the population of the country was faring under the economic stress caused by the reaction to the pandemic. The current survey, designated Week 42, posed questions which are part of what Census calls Phase 3.3 of the survey.
The Week 42 survey collected data from January 26 to February 7. This is 4 weeks after the period in which the “Week 41” survey data was collected. The renter portion of the survey covers renters of both multifamily and of single-family properties.
Tracking delinquencies
Renters in all phases of the survey have been asked whether they are behind on their rent. While some say that they occupy their housing without paying rent and some did not report whether they are current on their payments, the majority of respondents answered the question Yes or No. The portion of respondents who pay rent saying that they are not current has varied from survey to survey. The first chart, below, shows the history of responses to this question. Note that the “Week 42” survey was actually taken 88 weeks after the initial Pulse Survey.
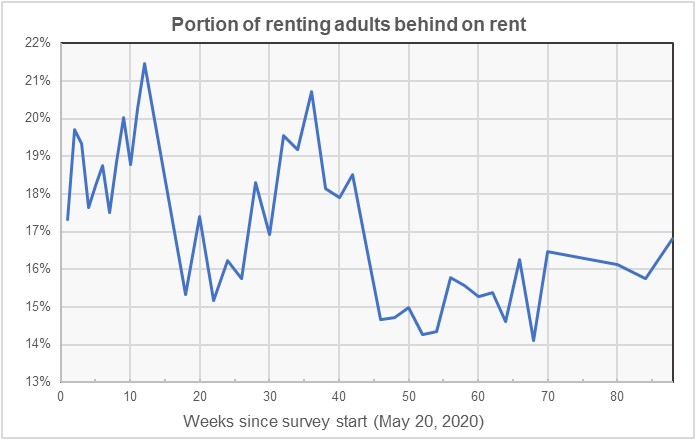
The chart shows that the portion of renters who are behind on their rent varied more dramatically in the earlier weeks of the survey. The portion who are behind has remained relatively stable over the past 20 weeks, varying between 15.8 and 16.8 percent.
Seeking help
A new question introduced in Phase 3.3 of the Pulse survey asked whether the respondent had sought government assistance in paying their rent. The answers to this question are nearly unchanged in the 8 weeks that have elapsed since it was first asked. The Week 42 answers are summarized in the first chart, below.
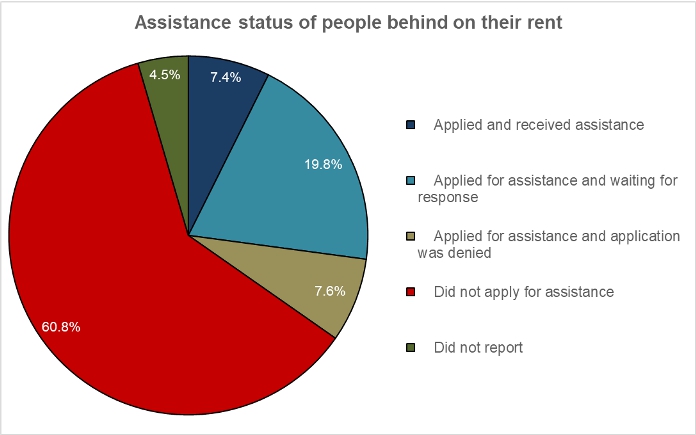
The chart shows that 34.8 percent of survey respondents who are behind on their rent applied for rental assistance. About half of applicants who received an answer to their request were granted assistance; 7.4 percent of survey respondents received assistance and 7.6 percent were denied it. However, 19.8 percent of survey respondents were still waiting to hear whether they will be granted assistance or not.
Of all survey respondents, 29 percent of those receiving rental assistance reported that they are still behind on their rent.
The Pulse survey identified 2,877,902 households who had received rental assistance by the end of January. However, the U.S. Treasury reported that 4,270,967 households had received emergency rental assistance under the two programs passed by Congress in response to the pandemic.
Profiling the participants
The Pulse Survey asked a series of questions to determine the characteristics of the different households responding to the survey. One question was how many people are in the household. The responses are shown in the next chart, below. The bars show the percentage of respondents within a particular category (current or not current on rent) who responded a certain way.
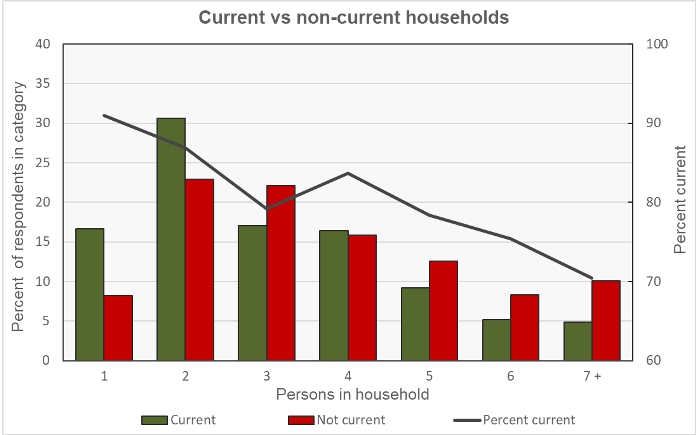
This chart is a little busy so here is an example of how to read the data for a two-person household: the bars on the chart show that about 31 percent of adults who were current on their rent resided in two-person households. About 23 percent of adults with rent delinquencies resided in two-person households. In either case, the two-person household could consist of one adult and one child or it could consist of two adults; the survey does not differentiate between them. The right-hand scale and the black line indicate that about 87 percent of adults residing in two-person households were current on their rent.
Of the respondents who reported being current on their rent, 35 percent said that they had children in the household. Of those reporting being behind on their rent, 52 percent reported having children in the household.
Of the respondents who reported being current on their rent, 78 percent said that they or a household member had experienced no loss of employment income over the prior 4 weeks. Of those reporting being behind on their rent, 48 percent reported that they or a household member had experienced a loss of employment income.
The next chart shows the current/not current status of the respondents by household income level. As in the above chart, the bars show the percentage of adults within a particular category (current or not current on the rent) who reported having a certain household income level. Not surprisingly, a much higher percentage of adult respondents with rent delinquencies reported having lower incomes.
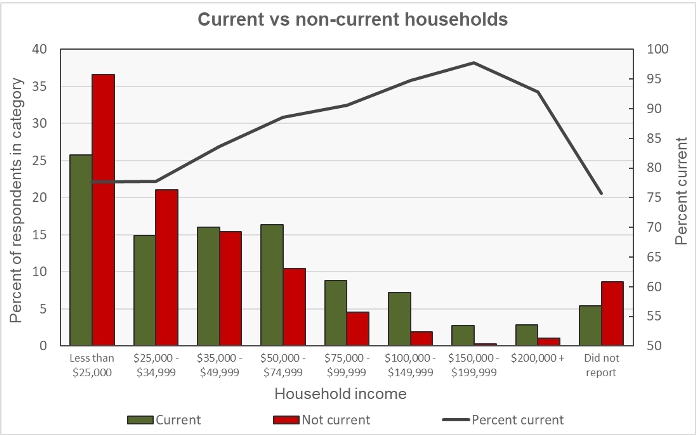
An example of reading this chart for the “Less than $25,000” category is that about 26 percent of responding adults who were current on their rent reported living in households with incomes of less than $25,000. About 37 percent of adults who were behind on their rent reported living in households whose income was less than $25,000. The black line is read on the right-hand scale. It indicates that about 78 percent of adults living in households earning less than $25,000 reported that they were current on their rent.
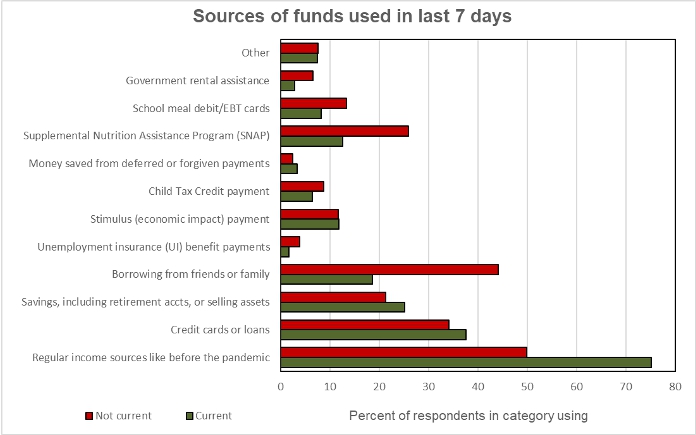
The final chart shows the sources of the funds survey respondents used to meet spending needs. Many of the differences between the people who are current on their rent and those with rent delinquencies are as one would expect: the former are more likely to rely on regular sources of income while the latter are more likely to rely on borrowing and on government assistance.