

The latest rent report from Apartment List shows that the national average rent rose in February, increasing 0.6 percent month-over-month and 17.6 percent year-over-year.
Rent growth and vacancy rates
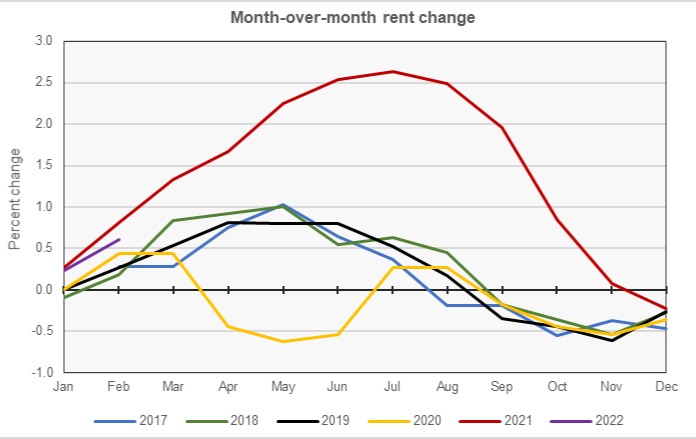
In the four years before 2020 for which Apartment List has data on the month-over-month rent growth for February, rents were up between 0.2 and 0.4 percent for the month. By contrast, in the extraordinary year of 2021, rents jumped 0.8 percent in February. For 2022, the February month-over-month rent growth was 0.6 percent, high, but off the pace set the year before.
The first chart, below, shows the history of the month-over-month change in the national average rent since 2017. The pattern of month-over-month rent changes was similar in the years 2017 through 2019 but changed significantly with the onset of the pandemic in March 2020. The summer weakness in rent growth in 2020 was more than offset by the summer strength of rent growth in 2021. Thus far, 2022 has started out closer to 2021 in performance than to the years before. How the year will play out remains to be seen.
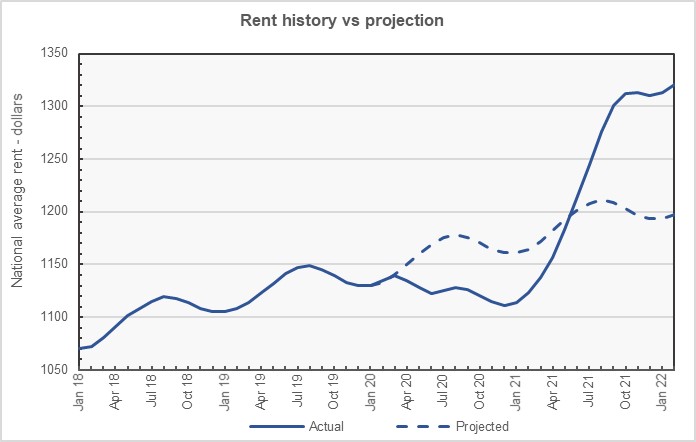
The next chart, below, shows the history of the national average transacted rents since January 2018. It also includes a projection of how rents would have grown since 2020 if rent growth in that period had followed the pattern of the prior two years. This shows that rent growth significantly underperformed the historical pattern in 2020 but significantly overperformed in 2021. The start of 2022 seems to be following the normal seasonal pattern of rent growth.
The Apartment List report also discussed the effects of changes in the vacancy rate on rent growth. They noted that the vacancy rate was around 6 percent in the summer of 2019 but jumped to 7.1 percent in April 2020 when the pandemic-inspired lockdowns were imposed. It fell as low as 3.8 percent in the summer of 2021 when national average rent growth was at its highest. Recently, vacancies have been trending upward and now are at 4.5 percent. This trend of rising vacancies may indicate that the extreme rate of rent growth seen in 2021 is unlikely to be repeated this year.
Leaders and trailers
Apartment List provides the underlying data they collected in compiling their report and that data was used to create the charts above and the tables below. The tables look at the 50 largest metropolitan statistical areas by population as defined by the US Census Bureau and identify the top 10 and bottom 10 metros for year-over-year rent growth. The tables provide the average monthly rent in the metro, the annual percentage change in rent (YoY Metro) along with the percentage change from the prior month’s rent level (MoM Metro). They also list the percentage change in rent for the metro area compared to the rent level in February 2020, right before the pandemic struck (Feb 20).
The first table shows the 10 metros with the smallest annual rent increases. Only one of these metros saw its rent fall month-over-month in February. Overall, 4 of the 50 largest metros saw rents decline or remain unchanged month-over-month in February.
Of the metros listed in the first table, only San Francisco has rents that are still below their pre-pandemic levels. Of the other largest metros, only San Jose, Calif. also has rents that are still below their pre-pandemic levels. Rents there are down by 4.3 percent.
| Metro | Metro Rent | YoY Metro | MoM Metro | Feb 20 |
| Minneapolis | $1,294 | 6.9 | 0.7 | 1.5 |
| Detroit | $1,158 | 9.7 | 0.3 | 15.3 |
| Kansas City | $1,178 | 9.9 | 0.3 | 11.2 |
| St Louis | $1,110 | 9.9 | 0.2 | 12.0 |
| Louisville | $1,007 | 9.9 | 0.6 | 10.5 |
| Milwaukee | $1,089 | 10.1 | 0.5 | 11.8 |
| Pittsburg | $1,002 | 10.6 | -0.7 | 7.7 |
| Cleveland | $995 | 10.7 | 0.5 | 13.8 |
| Harford | $1,500 | 10.9 | 0.3 | 15.2 |
| San Francisco | $2,258 | 11.9 | 1.2 | -4.7 |
The metros in the top 50 by population with the largest year-over-year rent increases are listed in the next table, below. Not only are rents up significantly over the last 12 months, they are also up significantly since February 2020. Only two of the metros listed in this table, experienced negative rent growth for the month of February.
| Metro | Metro Rent | YoY Metro | MoM Metro | Feb 20 |
| Miami | $2,022 | 30.7 | 0.9 | 31.4 |
| Tampa | $1,722 | 30.4 | 0.5 | 36.9 |
| Orlando | $1,718 | 28.2 | 0.9 | 25.2 |
| Phoenix | $1,729 | 27.0 | 0.2 | 33.5 |
| Las Vegas | $1,640 | 25.3 | -0.3 | 32.4 |
| Jacksonville | $1,520 | 24.8 | -0.4 | 30.1 |
| Austin | $1,692 | 23.7 | 0.8 | 20.9 |
| Raleigh | $1,498 | 21.6 | 0.9 | 23.8 |
| Atlanta | $1,564 | 21.5 | 0.2 | 26.2 |
| Salt Lake City | $1,554 | 21.5 | 0.7 | 24.6 |
The complete Apartment List report covers many more metros and contains some interesting charts illustrating how rents have changed over time in the hardest hit markets. It also provides readers with the opportunity to download their data sets. It can be found here.


