

A new report from Real Capital Analytics (RCA) said that multifamily property prices rose 22.4 percent year-over-year in March and that they rose 1.1 percent from the month before. The annual rate of increase is down from that posted last month and breaks a 7-month string of record high increases.
Defining CPPI
Real Capital Analytics tracks an index they call the Commercial Property Price Index (CPPI). The index is computed based on the resale prices of properties whose earlier sales prices and sales dates are known. The index represents the relative change in the price of property over time rather than its absolute price. Note that, as properties are added to the RCA dataset each month, they recalculate the CPPI all the way back to the beginning of the data series.
Torrid price growth moderates
Price appreciation in March for all commercial property as a single asset class was 17.4 percent year-over-year. However, prices for all commercial property as a single asset class fell by 0.4 percent from the level of the previous month, the first decline since June 2020.
Price appreciation for industrial properties was 1.9 percent for the month and 30.1 percent over the past 12 months, once again the highest rates of any commercial property type covered. Office buildings as a single property class experienced 0.2 percent price appreciation for the month and 10.3 percent price growth for the last 12 months. Suburban offices appreciated 9.3 percent year-over-year. However, office buildings within central business districts (CBDs) saw prices rise only 7.5 percent over the prior 12 months, making them the worst performing commercial property sector that RCA tracks.
Tracking price appreciation
The first chart, below, plots the year-over-year changes in the values of the CPPI since January 2012 for all commercial property as a single asset class and for apartments. The chart shows that the recent price runup for commercial property as-a-whole has started to subside, while the rate of apartment price growth has seemingly reached a plateau.
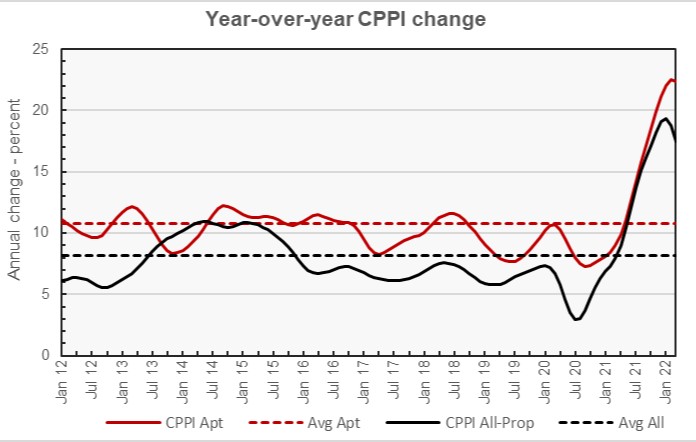
The chart also shows the average rates of annual appreciation in the indexes for the two property classes. The average annual appreciation for apartments since January 2012 is 10.7 percent, while the average annual appreciation rate for all commercial property as a single asset class is 8.2 percent.
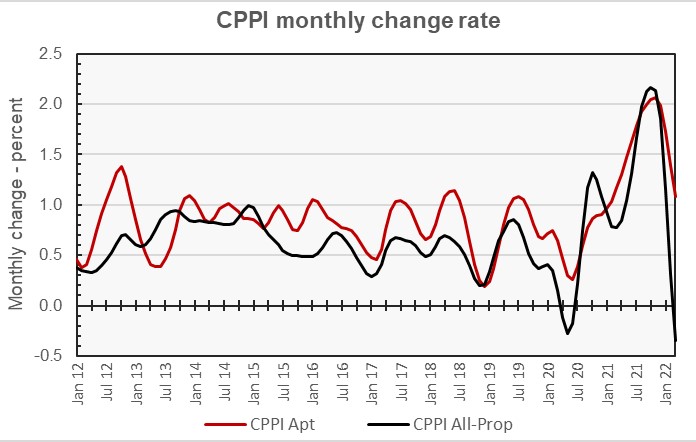
The next chart, below, plots the month-over-month change in the value of the CPPI since January 2012 for all commercial property as a single asset class and for apartments. The chart shows that the monthly rates of increases in the indexes have crested and are now declining.
The report indicated that the year-over-year rise in the prices for garden-style apartment buildings was about 25 percent while the prices of mid-rise and high-rise apartments were up around 12 percent.
Metros with the highest rates of year-over-year price appreciation were Phoenix, Raleigh/Durham, Miami, Fort Myers and Charlotte.
Major metros lag
The RCA report provides data comparing the price changes of commercial property in 6 major metro areas* against those in the rest of the country, although it does not separate out apartments from other commercial property types in this comparison. The next chart, below, plots the history of the year-over-year change in the price indexes for the two types of property markets since January 2012. It also shows the average rates of price appreciation for the two property markets over that time. The chart shows that the price appreciation of commercial property in non-major metros has outpaced that in major metros since 2020.
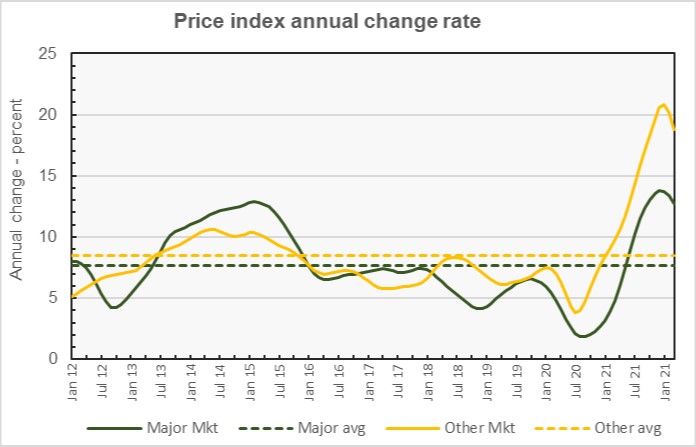
By the numbers, price appreciation for commercial property in major markets was reported to be 0.4 percent for the month and 12.7 percent for the year. Price appreciation for commercial property in non-major markets was reported to be negative for the month, falling 0.4 percent. Price appreciation in non-major markets for the year was 18.8 percent.
The average annual price appreciation since January 2012 for the major markets was 7.7 percent while that for the non-major markets was 8.5 percent. However, the average annual price increases for the two property classes for the period between January 2012 and February 2020 was 7.8 percent for major markets and 7.7 percent for non-major markets, showing that the greater rise in non-major metro prices for the full time period since January 2012 is being driven by the run-up in these prices since the onset of the pandemic.
The full report provides more detail on other commercial property types. Access to the RCA report can be obtained here.
*The major metros are Boston, Chicago, Los Angeles, New York, San Francisco and Washington DC.


