

The Census Bureau’s report on construction spending shows that the value of residential construction put in place in February was up 1.1 percent from the revised level of the month before. Residential construction spending was up 16.5 percent year-over-year.
Single-family construction spending rises
The reported value of total private residential construction put in place in February 2022 was $850.6 billion on a seasonally adjusted, annualized basis. This figure, which includes spending on both new construction and on improvements, was reported to be up $9.4 billion from January’s revised figure. Because, the figure reported for January was revised upward by $11.8 billion, the preliminary figure for February is actually up by $21.2 billion from the preliminary figure for January reported last month.
The value of new private construction of multifamily residential buildings put in place in February was reported to be $101.5 billion on a seasonally adjusted, annualized basis. This was up $68 million from the level for January. The value of multifamily housing construction put in place in February 2022 was 7.8 percent higher than the level of February 2021.
State and local governments were reported to have put $9.3 billion in multifamily residential construction in place in February on a seasonally adjusted annualized basis.
The value of new single-family residential construction put in place in February was $465.4 billion on a seasonally adjusted, annualized basis. This was up $11.4 billion from the revised (+$8.8 billion) level for January and was up 20.0 percent from the level of February 2021.
The value of improvements to residential buildings put in place in February was reported to be $283.7 billion on a seasonally adjusted, annualized basis. This was up 14.8 percent from the year-earlier level but was down 0.7 percent from the revised (+$3.0 billion) level for January. The Census Bureau does not separate out improvements for single-family and multifamily residential buildings.
Charting the data
The chart, below, shows the history of new private residential construction spending since January 2000 for single-family housing, multifamily housing and residential improvements. It also shows a trendline for single-family construction based on the relatively steady growth in the value of construction put in place between 2013 and 2018.
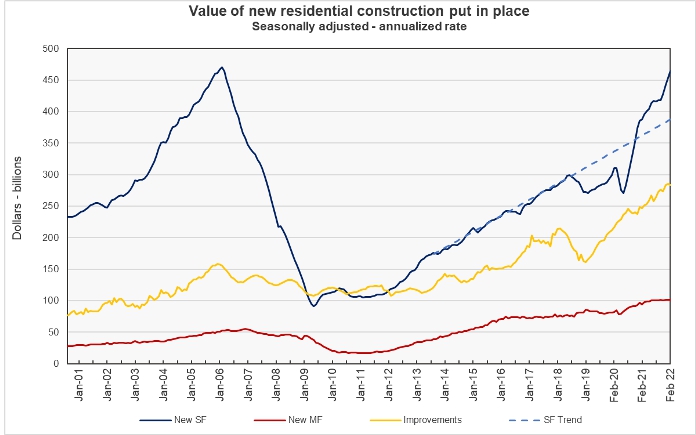
The chart shows that the value of single-family housing put in place in February is now only about 1.1 percent below the peak level it reached in February 2006 during the housing bubble. The value of multifamily housing put in place in February is 84 percent higher than the prior peak reached in December 2006.
The chart shows that the value of multifamily residential construction put in place each month has been nearly flat since last summer. This is remarkable given that the Census Bureau’s report on new residential construction shows that the number of unit completions in February was significantly lower than the average level from that time.
The report from the Census Bureau also includes information on spending on other types of construction projects. The full report can be found here.


