

The latest rent report from Apartment List shows that the national average rent growth in April reached 1.0 percent month-over-month and 16.4 percent year-over-year.
The history of rent growth
The last two years have been extraordinary in terms of rent growth. The first pandemic year, 2020, saw rent growth underperform, while 2021 saw rent growth soar. So far, 2022 appears to be following a pattern more in line with the pre-pandemic years than either of the last two years. This is illustrated in the first chart, below, which shows the month-over-month growth in the national average rent.
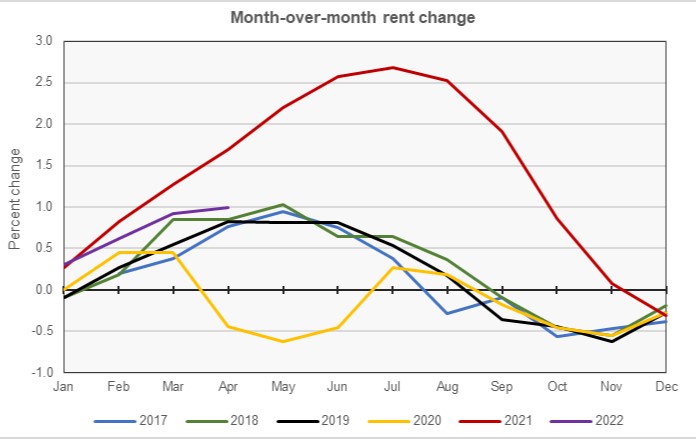
The most unusual month of the year 2022 to date has been January, which saw significant month-over-month rent growth at a time of year when rents are usually flat to declining. However, the month-over month rent growth in the following months were only slightly above the levels in the same months of the pre-pandemic years.
Apartment List reported that vacancies broke the string of increases they had been on since June 2021, falling from 4.7 percent in March to 4.6 percent in April. A recent report from the Census Bureau also found that vacancies were rising in Q1 of this year, although Census found that the national average vacancy rate was 5.8 percent.
Leaders and trailers
Apartment List provides the underlying data they collected in compiling their report and that data was used to create the tables, below. The tables look at the 50 largest metropolitan statistical areas by population as defined by the US Census Bureau and identify the top and bottom 10 metros for year-over-year rent growth. The tables provide the average monthly rent in the metro, the annual percentage change in rent (YoY Metro) along with the percentage change from the prior month’s rent level (MoM Metro). They also list the percentage change in rent for the metro area compared to the rent level in February 2020, right before the pandemic struck (Feb 20).
The first table shows the 10 metros with the largest annual percentage rent increases. None of these metros saw its rent fall month-over-month in April.
| Metro | Metro Rent | YoY Metro | MoM Metro | Feb 20 |
| Miami | $2,021 | 29.6 | 1.0 | 34.5 |
| Orlando | $1,632 | 28.2 | 1.8 | 29.6 |
| Tampa | $1,668 | 28.0 | 0.9 | 39.5 |
| Phoenix | $1,637 | 22.9 | 0.2 | 34.4 |
| Las Vegas | $1,549 | 21.8 | 0.3 | 33.2 |
| Nashville | $1,446 | 21.7 | 1.3 | 23.2 |
| Austin | $1,635 | 21.6 | 1.2 | 23.7 |
| Jacksonville | $1,489 | 20.8 | 0.3 | 30.8 |
| Raleigh | $1,472 | 20.7 | 1.0 | 26.7 |
| Salt Lake City | $1,571 | 20.1 | 1.0 | 27.3 |
The next table shows the 10 metros with the smallest annual rent growth. None of these metros saw its rent fall month-over-month in April.
Of the 50 largest metros, only San Francisco (-2.6 percent) and San Jose (-0.4 percent) have average rent levels that are still below those from February 2020.
| Metro | Metro Rent | YoY Metro | MoM Metro | Feb 20 |
| Minneapolis | $1,215 | 6.6 | 0.9 | 3.9 |
| Pittsburg | $970 | 7.7 | 0.5 | 8.9 |
| St Louis | $1,083 | 9.2 | 1.0 | 13.2 |
| Kansas City | $1,143 | 9.5 | 1.3 | 13.8 |
| Detroit | $1,146 | 10.2 | 1.5 | 17.9 |
| Milwaukee | $1,084 | 10.7 | 1.1 | 14.7 |
| San Francisco | $2,111 | 10.8 | 0.8 | -2.6 |
| Cleveland | $989 | 11.1 | 1.4 | 17.6 |
| Baltimore | $1,605 | 11.5 | 0.8 | 16.9 |
| Portland | $1,517 | 11.5 | 0.7 | 13.0 |
The complete Apartment List report covers many more metros. It also provides readers with the opportunity to download their data sets. It can be found here.


