

The latest rent report from Apartment List shows that the national average apartment rent rose in June, increasing 1.3 percent month-over-month and 14.1 percent year-over-year. While still very strong, the year-over-year rate is down from last month’s level and is the lowest rate of rent growth since August 2021.
The pattern of rent growth
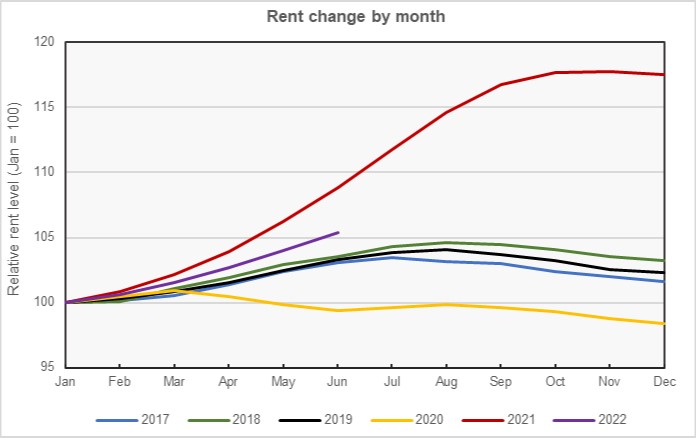
Rents usually rise in spring through summer and that pattern is holding true this year. This is illustrated in the next chart, below, which shows how rents change throughout the year. This chart normalizes the rent in each year to a value of 100 in January so that the annual patterns of growth can be more directly compared. The chart shows that rent growth in 2022 is increasing at a rate slightly above those of the pre-pandemic years of 2017 through 2019, but at a rate well below that of 2021.
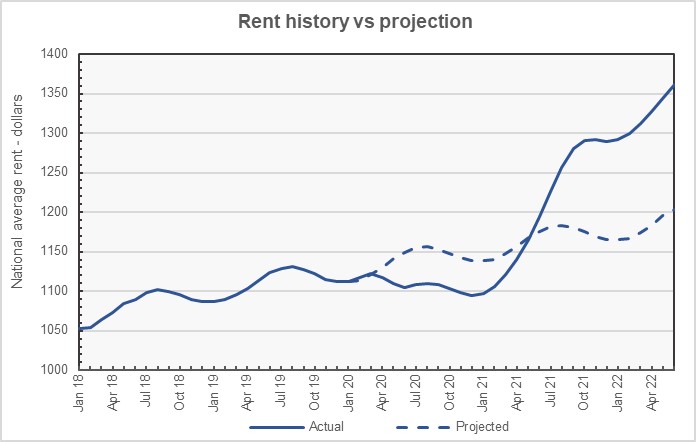
The history of rent changes for the last 4+ years is shown in the first chart, below, along with a projection of where rents would be if the pattern of growth that existed before the pandemic had continued. It shows that rent growth deviated to the downside when the pandemic first arrived, but that it has greatly exceeded its previous trend since the recovery took hold. By this estimate, rents are now about $158 per month (13 percent) above where they would have been if they had followed the prior trend.
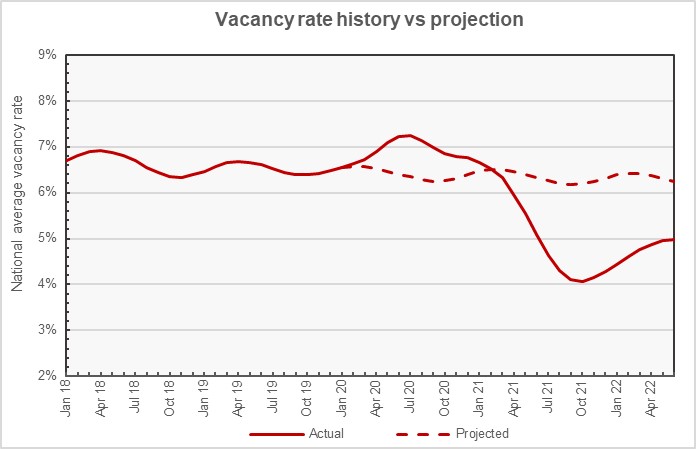
Apartment List is now making their apartment vacancy rate data available and it was used to create the next chart, below. This chart plots the actual vacancy history since January 2018 along with a projection of how the apartment vacancy rate history would have unfolded after February 2020 if it had followed the pre-pandemic pattern. The chart shows that vacancies rose well above trend at the onset of the pandemic but then fell to well below trend after the recovery began.
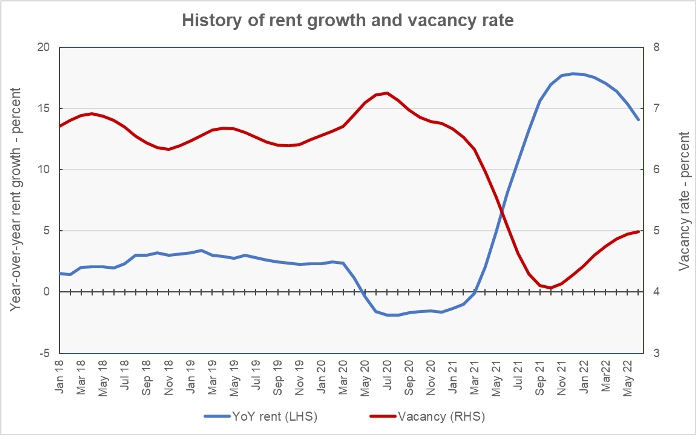
The final chart shows the year-over-year rate of rent growth since January 2018 plotted along with the national average apartment vacancy rate. It shows how the two metrics moved in opposite directions after March 2020.
The swift and the dead
Apartment List provides the underlying data they collected in compiling their report and that data was used to create the tables, below. The tables look at the 52 metropolitan statistical areas defined by the US Census Bureau with populations over 1 million and identify the top and bottom 10 metros for year-over-year rent growth. The tables provide the average monthly rent in the metro, the metro’s vacancy rate, the annual percentage change in rent (YoY Metro) along with the percentage change from the prior month’s rent level (MoM Metro). They also list the percentage change in rent for the metro area compared to the rent level in February 2020, right before the pandemic struck (Feb 20).
The first table shows the 10 metros with the largest annual rent percentage increases. None of these metros saw its rent fall month-over-month in June.
| Metro | Metro Rent | Vacancy | YoY Metro | MoM Metro | Feb 20 |
| Miami | $2,059 | 4.5 | 24.8 | 0.9 | 36.9 |
| Orlando | $1,688 | 4.8 | 23.9 | 1.6 | 34.0 |
| Tucson | $1,349 | 5.9 | 20.9 | 3.4 | 39.8 |
| Tampa | $1,702 | 4.9 | 20.5 | 1.2 | 42.4 |
| San Diego | $2,372 | 3.1 | 20.4 | 2.2 | 32.1 |
| Nashville | $1,496 | 5.1 | 19.4 | 1.6 | 27.4 |
| New York | $2,061 | 3.2 | 19.3 | 2.4 | 18.2 |
| Raleigh | $1,528 | 4.9 | 18.0 | 1.9 | 31.6 |
| Charlotte | $1,440 | 5.5 | 17.6 | 2.0 | 27.7 |
| Austin | $1,682 | 5.9 | 17.5 | 1.5 | 27.1 |
The next table shows the 10 metros with the smallest annual rent increases. None of these metros saw its rent fall month-over-month in June.
Of the 52 metros with populations over 1 million, only San Francisco (-0.7 percent) still has average rent levels that are below those from February 2020.
| Metro | Metro Rent | Vacancy | YoY Metro | MoM Metro | Feb 20 |
| Minneapolis | $1,232 | 6.3 | 5.3 | 0.5 | 5.5 |
| Pittsburg | $1,014 | 7.6 | 7.6 | 2.1 | 14.1 |
| Sacramento | $1,777 | 4.0 | 7.8 | 0.6 | 26.1 |
| San Francisco | $2,154 | 5.0 | 8.1 | 1.1 | -0.7 |
| Baltimore | $1,645 | 4.3 | 8.7 | 1.2 | 19.8 |
| Virginia Beach | $1,605 | 4.1 | 9.1 | 1.1 | 26.4 |
| St Louis | $1,104 | 4.1 | 9.2 | 0.9 | 15.2 |
| Detroit | $1,179 | 4.0 | 9.4 | 1.4 | 21.2 |
| Kansas City | $1,187 | 4.4 | 9.8 | 1.8 | 18.6 |
| Houston | $1,291 | 6.2 | 9.9 | 0.8 | 13.2 |
The complete Apartment List report covers many more metros. It also provides readers with the opportunity to download their data sets. It can be found here.


