

The Census Bureau’s report on construction spending shows that residential construction spending in April was up 0.9 percent from the revised level of the month before. Residential construction spending was up 18.4 percent year-over-year.
Single-family construction spending up again
The reported value of total private residential construction put in place in April 2022 was $891.5 billion on a seasonally adjusted, annualized basis. This figure, which includes spending on both new construction and on improvements, was reported to be up $8.0 billion from March’s revised figure. The preliminary March figure was also revised upward by $1.5 billion from the value reported last month.
The value of new private construction of multifamily residential buildings put in place in April was reported to be $102.2 billion on a seasonally adjusted, annualized basis. This was reported to be up $0.8 billion from the revised (+$0.3 billion) level for March. The value of multifamily housing construction put in place in April 2022 was 3.1 percent higher than the level of April 2021.
State and local governments were reported to have put $8.9 billion in residential construction in place in April on a seasonally adjusted annualized basis.
The value of new single-family residential construction put in place in April was $477.7 billion on a seasonally adjusted, annualized basis. This was up 0.5 percent from the revised (+$2.5 billion) level for March and was up 19.3 percent from the level of April 2021.
The value of improvements to residential buildings put in place in April was reported to be $311.6 billion on a seasonally adjusted, annualized basis. This was up 23.1 percent from the year-earlier level and was up 1.5 percent from the revised (+$4.7 billion) level for March. The Census Bureau does not separate out improvements for single-family and multifamily residential buildings.
Charting the data
The first chart, below, shows the history of new private residential construction spending since January 2000 for single-family housing, multifamily housing and residential improvements.
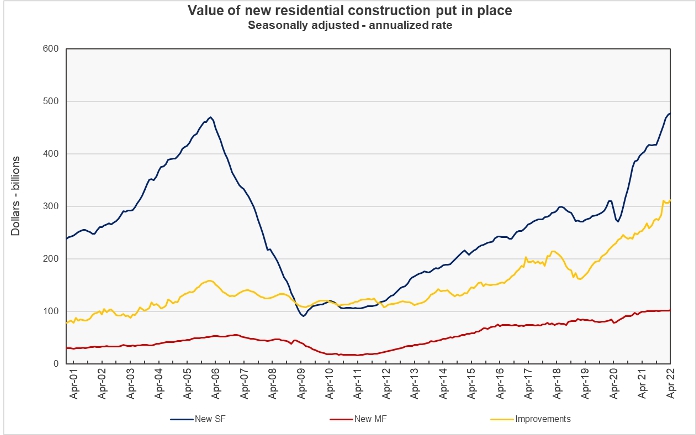
The chart shows that the value of single-family housing put in place in April is now 1.5 percent above the peak level it reached in February 2006 during the housing bubble. However, when the values are corrected for inflation using the CPI-U, the value of the single-family housing put in place in April is still about 30 percent below the peak level reached in 2006.
The value of multifamily housing put in place in April is 86 percent higher than the prior peak reached in December 2006 in unadjusted dollars.
The next chart shows the residential construction spending each month relative to its level in January 2016, along with trendlines for single-family and multifamily construction spending. This chart allows the recent rates of change in the values of the three categories of residential construction to be compared. It also allows the recent plateau in the value of multifamily residential construction put in place to be more clearly seen.
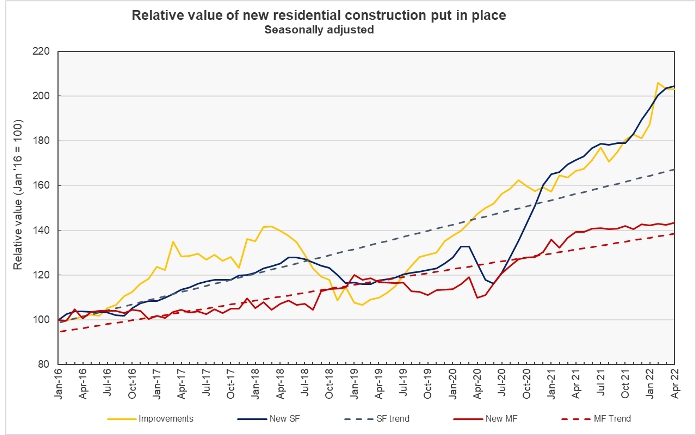
While the value of multifamily housing put in place has been running above its trend line since late 2020, its slow rate of growth is resulting in it slowly returning to trend.
The report from the Census Bureau also includes information on spending on other types of construction projects. The full report can be found here.


